Unlock a world of possibilities! Login now and discover the exclusive benefits awaiting you.
- Qlik Community
- :
- Forums
- :
- Analytics
- :
- New to Qlik Analytics
- :
- Re: Counting within a field
- Subscribe to RSS Feed
- Mark Topic as New
- Mark Topic as Read
- Float this Topic for Current User
- Bookmark
- Subscribe
- Mute
- Printer Friendly Page
- Mark as New
- Bookmark
- Subscribe
- Mute
- Subscribe to RSS Feed
- Permalink
- Report Inappropriate Content
Counting within a field
I have a data set of trees. Each tree has a species (one of 500) and a condition (one of 7: good, poor, dead, etc.). I'm trying to make a stacked bar chart that shows, for each species, the proportion of trees with each of the conditions. For example,
tree 1: maple good
tree 2: maple poor
tree 3: maple good
tree 4: oak good
tree 4: oak poor
If I do something like: Count(Condition), I just get:
maple 3
oak 2
That is, it counts the number of trees of each species that have any value for condition (which is all of them). How can I show the results:
maple
good 2
poor 1
oak
good 1
poor 1
I'm really new to this, so grateful for any help.
Accepted Solutions
- Mark as New
- Bookmark
- Subscribe
- Mute
- Subscribe to RSS Feed
- Permalink
- Report Inappropriate Content
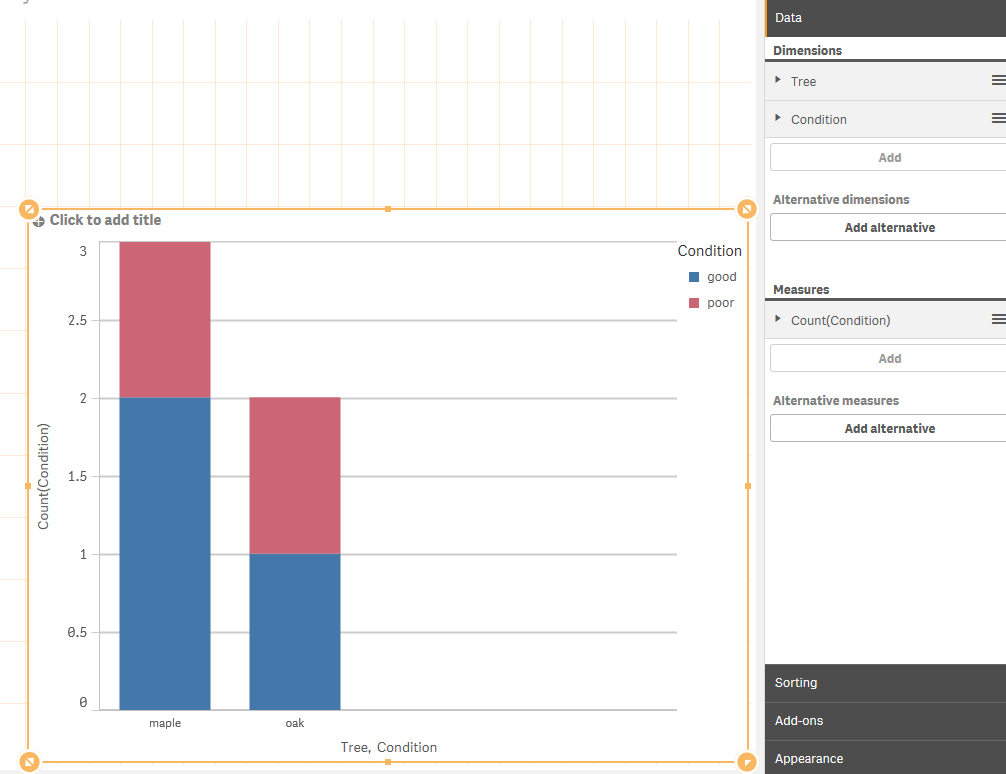
Hi, add both Tree and condition as dimensions. Then add count(condition) as expression.
Display as stacked bar chart
- Mark as New
- Bookmark
- Subscribe
- Mute
- Subscribe to RSS Feed
- Permalink
- Report Inappropriate Content
Hi, add both Tree and condition as dimensions. Then add count(condition) as expression.
Display as stacked bar chart
- Mark as New
- Bookmark
- Subscribe
- Mute
- Subscribe to RSS Feed
- Permalink
- Report Inappropriate Content
Hi,
assume, you have data like this,
Data:
LOAD * INLINE [
F1,F2,F3
tree 1,maple,good
tree 2,maple,poor
tree 3,maple,good
tree 4,oak,good
tree 4,oak,poor
];
Create pivot chart and create aggregate field like below,
Dimensions : F2 & F3
Measure: aggr(Count(F1),F2,F3)
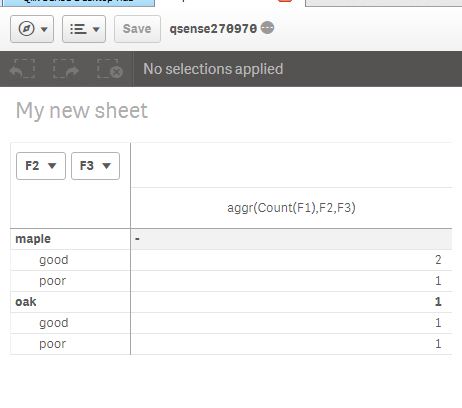
Thanks,
Deva
- Mark as New
- Bookmark
- Subscribe
- Mute
- Subscribe to RSS Feed
- Permalink
- Report Inappropriate Content
Thanks so much to you both! Both answers worked fine, but I realized I was a little unclear--the bar chart was just what I was looking for. Very grateful for the quick and thorough help.
~Kelaine