Unlock a world of possibilities! Login now and discover the exclusive benefits awaiting you.
- Qlik Community
- :
- Forums
- :
- Analytics
- :
- New to Qlik Analytics
- :
- Create Bar chart with information from different c...
- Subscribe to RSS Feed
- Mark Topic as New
- Mark Topic as Read
- Float this Topic for Current User
- Bookmark
- Subscribe
- Mute
- Printer Friendly Page
- Mark as New
- Bookmark
- Subscribe
- Mute
- Subscribe to RSS Feed
- Permalink
- Report Inappropriate Content
Create Bar chart with information from different columns
Hello i´m new in qlik sense.
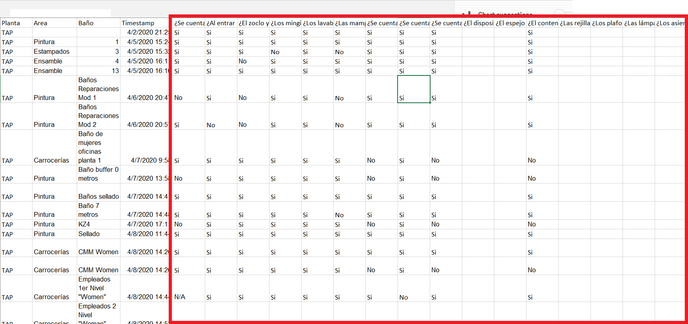
I want to create a bar chart in which it search from different columns the value 'No', i have created one using the 15 measures that it allow me to, but i am still left with 2 other columns to add from my file and i can´t sort it as it is on different measures, and not in a dimension.
this is the source file where i have the different columns and what to count in every columns the 'No'
This is the expression i am using in the measurement but i don´t think it will help with what i want to do
Thanks a lot for reading this.
- Mark as New
- Bookmark
- Subscribe
- Mute
- Subscribe to RSS Feed
- Permalink
- Report Inappropriate Content
Best way is to do a crosstable in your load script to convert those field names into a dimension; then your chart will be much easier to implement


