Unlock a world of possibilities! Login now and discover the exclusive benefits awaiting you.
- Qlik Community
- :
- Forums
- :
- Analytics
- :
- New to Qlik Analytics
- :
- Re: Create a bar chart group by column
- Subscribe to RSS Feed
- Mark Topic as New
- Mark Topic as Read
- Float this Topic for Current User
- Bookmark
- Subscribe
- Mute
- Printer Friendly Page
- Mark as New
- Bookmark
- Subscribe
- Mute
- Subscribe to RSS Feed
- Permalink
- Report Inappropriate Content
Create a bar chart group by column
| Worker | Period | A | B | C | D |
|---|---|---|---|---|---|
| 1 | 201601 | 1 | 1 | 0 | 0 |
| 2 | 201601 | 1 | 0 | 1 | 0 |
| 3 | 201601 | 0 | 0 | 0 | 0 |
| 4 | 201601 | 0 | 0 | 1 | 1 |
| 1 | 201602 | 1 | 1 | 1 | 0 |
| 2 | 201602 | 1 | 1 | 0 | 0 |
| 3 | 201603 | 1 | 1 | 1 | 0 |
| 4 | 201604 | 0 | 0 | 0 | 0 |
The table above is a simplified sample of the database that i'm using.
I would like to create a bar chart that shows the sum of workers who are using, A, B, C and D.
Could someone tell me the best way to handle this problem?
Accepted Solutions
- Mark as New
- Bookmark
- Subscribe
- Mute
- Subscribe to RSS Feed
- Permalink
- Report Inappropriate Content
Script:
CrossTable(USING,Value,2)
LOAD * INLINE [
Worker,Period,A,B,C,D
1,201601,1,1,0,0
2,201601,1,0,1,0
3,201601,0,0,0,0
4,201601,0,0,1,1
1,201602,1,1,1,0
2,201602,1,1,0,0
3,201603,1,1,1,0
4,201604,0,0,0,0
];
Grouped chart:
Dimensions: Period, USING
Expression Sum(Value)
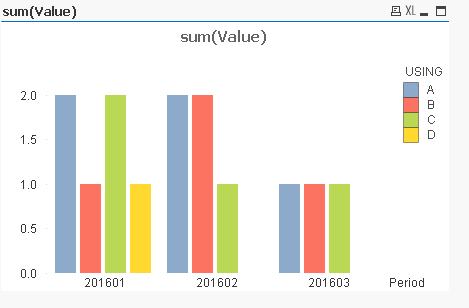
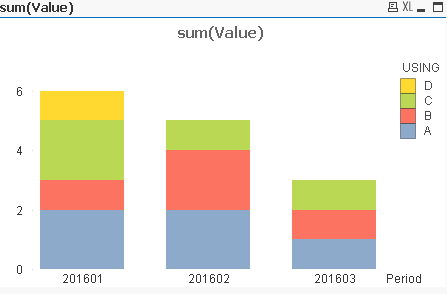
Stacked Chart
If a post helps to resolve your issue, please accept it as a Solution.
- Mark as New
- Bookmark
- Subscribe
- Mute
- Subscribe to RSS Feed
- Permalink
- Report Inappropriate Content
Workers using A:
Count({<A = {'1'}>}Worker)
Similarly for others
- Mark as New
- Bookmark
- Subscribe
- Mute
- Subscribe to RSS Feed
- Permalink
- Report Inappropriate Content
I would like to create a Bar chart with as dimension A, B, D and count(Worker) as measure.
- Mark as New
- Bookmark
- Subscribe
- Mute
- Subscribe to RSS Feed
- Permalink
- Report Inappropriate Content
Script:
CrossTable(USING,Value,2)
LOAD * INLINE [
Worker,Period,A,B,C,D
1,201601,1,1,0,0
2,201601,1,0,1,0
3,201601,0,0,0,0
4,201601,0,0,1,1
1,201602,1,1,1,0
2,201602,1,1,0,0
3,201603,1,1,1,0
4,201604,0,0,0,0
];
Grouped chart:
Dimensions: Period, USING
Expression Sum(Value)
Stacked Chart
If a post helps to resolve your issue, please accept it as a Solution.
- Mark as New
- Bookmark
- Subscribe
- Mute
- Subscribe to RSS Feed
- Permalink
- Report Inappropriate Content
Try with
Dimension as
USING
and
Expression as
Count(Worker)
If a post helps to resolve your issue, please accept it as a Solution.
- Mark as New
- Bookmark
- Subscribe
- Mute
- Subscribe to RSS Feed
- Permalink
- Report Inappropriate Content
Try:
Dimension : Valuelist('A','B','C')
Measure:
Pick(wildmatch(Valuelist('A','B','C'),'A','B','C'),
Count({<A = {'1'}>}Worker),
Count({<B = {'1'}>}Worker),
Count({<C = {'1'}>}Worker)
)