Unlock a world of possibilities! Login now and discover the exclusive benefits awaiting you.
- Qlik Community
- :
- Forums
- :
- Analytics
- :
- New to Qlik Analytics
- :
- Re: Create a dimension
- Subscribe to RSS Feed
- Mark Topic as New
- Mark Topic as Read
- Float this Topic for Current User
- Bookmark
- Subscribe
- Mute
- Printer Friendly Page
- Mark as New
- Bookmark
- Subscribe
- Mute
- Subscribe to RSS Feed
- Permalink
- Report Inappropriate Content
Create a dimension
Qlik experts,
Can I create a dimension based on a measure?
I need to create a chart where the dimension (x-axis) is the name of a measure. The measure is a count for grater than 8,7,6,5,4,3,2,1. The x-axis needs to be 8,7,6,5,4,3,2,1 and the y-axis is the count of custID greater than 8,7,6….
count({<Value1={">8"}>} CustID)
Please see sample app:
Accepted Solutions
- Mark as New
- Bookmark
- Subscribe
- Mute
- Subscribe to RSS Feed
- Permalink
- Report Inappropriate Content
Maybe add something like this to your script:
For i = 1 to 8
Groups:
LOAD DISTINCT
Value1,
$(i) as Group
Resident Data
WHERE Value1 > $(i);
Next i
Then use Group as dimension and just a Count(CustID) as expression.
edit: added DISTINCT
- Mark as New
- Bookmark
- Subscribe
- Mute
- Subscribe to RSS Feed
- Permalink
- Report Inappropriate Content
In Dimension you can use
=if(Value1>=8,Value1)
or You can do this in script as well
Data:
LOAD
Dato,
CustID,
Value1,
if(Value1>=8,Value1) as [Value8],
Value2
FROM [lib://Data/SampleData.xlsx]
(ooxml, embedded labels, table is Sheet1);
And then in front end just use [Value8] as your dimension
For measure use
count({<Value1={">8"}>} CustID)
- Mark as New
- Bookmark
- Subscribe
- Mute
- Subscribe to RSS Feed
- Permalink
- Report Inappropriate Content
Thanks!!
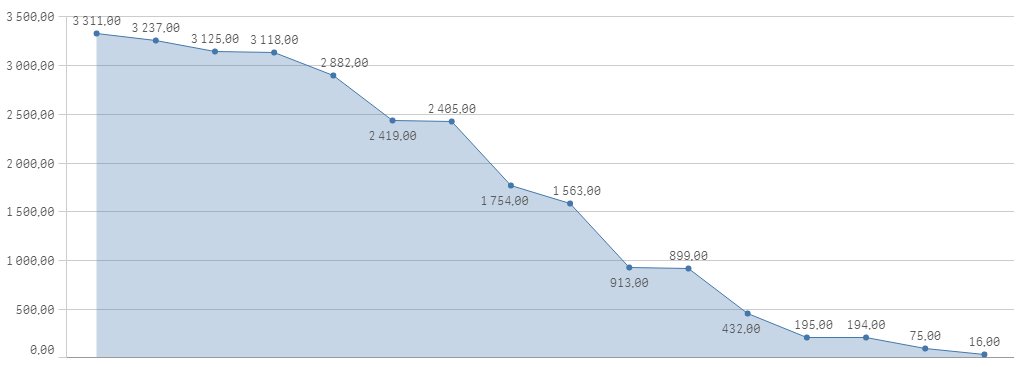
Can I add more values to the dimension? Like - if(Value1>=7,Value1),[Value7], if(Value1>=6,Value1) as [Value6]?
And can these be grouped on top of each other? See picture below (this is created based on a calculated excel-file)
- Mark as New
- Bookmark
- Subscribe
- Mute
- Subscribe to RSS Feed
- Permalink
- Report Inappropriate Content
Main X-axis would be only 1 but you can add 1 more dimension thats it.
For measure you can use Multiple Alternative measures but only 1 measure can be seen at a time
As for creating buckets you can create buckets based on number....
Search for creating Age buckets in community. You'll get an idea how to create new values based of >=8 , <=5 etc
- Mark as New
- Bookmark
- Subscribe
- Mute
- Subscribe to RSS Feed
- Permalink
- Report Inappropriate Content
Maybe add something like this to your script:
For i = 1 to 8
Groups:
LOAD DISTINCT
Value1,
$(i) as Group
Resident Data
WHERE Value1 > $(i);
Next i
Then use Group as dimension and just a Count(CustID) as expression.
edit: added DISTINCT
- Mark as New
- Bookmark
- Subscribe
- Mute
- Subscribe to RSS Feed
- Permalink
- Report Inappropriate Content
Thanks, Stefan
Your suggestion works fine!
One follow-up question: In Data load editor I normally use Qualify *; and Unqualify Dato; to connect keys between datasets. When I use this, loading following your suggestion I get an error message saying that Vaule1 is missing. When I remove Qualify and Unqualify, it works fine.
Do you have any suggestion why this happens? Or should I not use qualify and Unqualify at all in Data Load Editor?
Thanks for your help!