Unlock a world of possibilities! Login now and discover the exclusive benefits awaiting you.
- Qlik Community
- :
- Forums
- :
- Analytics
- :
- New to Qlik Analytics
- :
- Create a hierarchy drill-down application
- Subscribe to RSS Feed
- Mark Topic as New
- Mark Topic as Read
- Float this Topic for Current User
- Bookmark
- Subscribe
- Mute
- Printer Friendly Page
- Mark as New
- Bookmark
- Subscribe
- Mute
- Subscribe to RSS Feed
- Permalink
- Report Inappropriate Content
Create a hierarchy drill-down application
Hi,
I'm relatively new to qlik sense, and I'm tasked with creating an application that will allow the user to see the hierarchy of people directly rattached to him, but with numbers aggregated within all the children of this hierarchy.
To simplify, I've tried creating a minimal example with a sample hierarchy. The hierarchy is defined as follow:
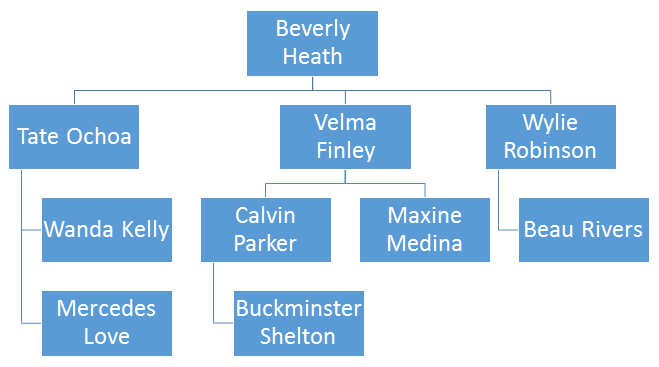
I've generated a simple load script that loads this data into a hierarchy model for unbalanced n-level hierarchy. (took from this document).
Here's the script:
Organization:
LOAD * INLINE [
User_Id,name,managerId
1,Beverly Heath,0
2,Tate Ochoa,1
3,Velma Finley,1
4,Calvin Parker,3
5,Maxine Medina,3
6,Wylie Robinson,1
7,Mercedes Love,2
8,Beau Rivers,6
9,Wanda Kelly,2
10,Buckminster Shelton,4
];
[Nodes]:
Hierarchy(User_Id, Manager_Id, Node, NodeParent, Node, NodePath, '/', NodeDepth) load
User_Id,
managerId as Manager_Id,
name as Node
resident Organization;
[TreeBridge]:
HierarchyBelongsTo (User_Id, Manager_Id, NodeName, TreeId, TreeName)
LOAD User_Id,
managerId as Manager_Id,
name as NodeName
Resident Organization;
[Trees]:
Hierarchy(TreeId, TreeParentId, Tree)
Load User_Id as TreeId,
managerId as TreeParentId,
name as Tree
Resident Organization;
Now, the issue is, I'm trying to, for now, add it to a "cross table" in order to have the drill-down behavior, and simply counting a distinct of the User_Id. I'm adding Node1-4 as the dimension, and remove null values for all.
It seem to work at first, as you can see:
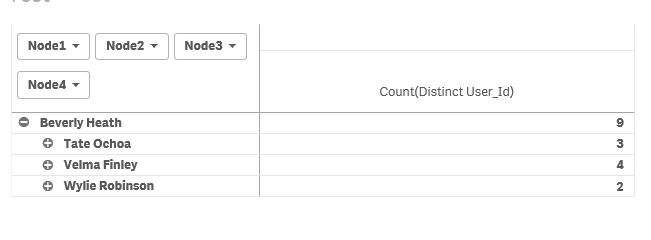
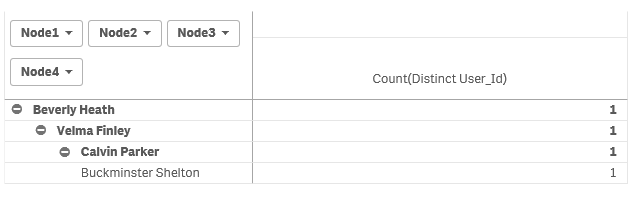
But once I start opening a few more path of the hierarchy, it "breaks" and most of the data is deleted, only showing one branch of the hierarchy tree.
I'm not sure whether this is a bug or something that I'm doing that is utterly wrong?
Thanks
- Mark as New
- Bookmark
- Subscribe
- Mute
- Subscribe to RSS Feed
- Permalink
- Report Inappropriate Content
That behaviour is caused when you suppress the null values because when a column has a null value the whole row is suppressed. Take Node 4 for instance, it's all nulls except for Buckminster Shelton so when you expand all the way to node 4 all the other rows are suppressed leaving you with one (the tree for Shelton).
I would say this is WAD on pivot tables.
Cheers
- Mark as New
- Bookmark
- Subscribe
- Mute
- Subscribe to RSS Feed
- Permalink
- Report Inappropriate Content
Thanks for the help.
I understand that this could be a wanted behavior of the pivot table, but then, what would be the way to do what I want to do? Should I use another type of graph?
- Mark as New
- Bookmark
- Subscribe
- Mute
- Subscribe to RSS Feed
- Permalink
- Report Inappropriate Content
Hi Xavier,
You can make use of drill down dimension to achieve what you are looking for. In the master dimension you will be able to specify the hierarchical order and this will help you drill down.
Thanks,
Sangram.
- Mark as New
- Bookmark
- Subscribe
- Mute
- Subscribe to RSS Feed
- Permalink
- Report Inappropriate Content
Hi ! 🙂
I allow myself to revive the subject.
I have the same problem
Reddys : What do you mean by "use the top down dimension"?
Thanks 🙂
- Mark as New
- Bookmark
- Subscribe
- Mute
- Subscribe to RSS Feed
- Permalink
- Report Inappropriate Content
I have implemented an unbalanced hierarchy using this model:

My data contains more than 97.000 records and 14 level depths. It looks great, but the problem is when I am searching for one element on the tree it shows the element with the (+) sign indicating there are more elements below that is good, but when I click on it, I cannot see the children of the node and then the tree is broken and the search starts to fail.

Because the tree is huge, I don't like the idea about to enable to show the null values.
Does anyone have found a solution for this?
