Unlock a world of possibilities! Login now and discover the exclusive benefits awaiting you.
- Qlik Community
- :
- Forums
- :
- Analytics
- :
- New to Qlik Analytics
- :
- Re: Create a pyramide of safety visualisation in Q...
- Subscribe to RSS Feed
- Mark Topic as New
- Mark Topic as Read
- Float this Topic for Current User
- Bookmark
- Subscribe
- Mute
- Printer Friendly Page
- Mark as New
- Bookmark
- Subscribe
- Mute
- Subscribe to RSS Feed
- Permalink
- Report Inappropriate Content
Create a pyramide of safety visualisation in Qlick Sense
Dear Users,
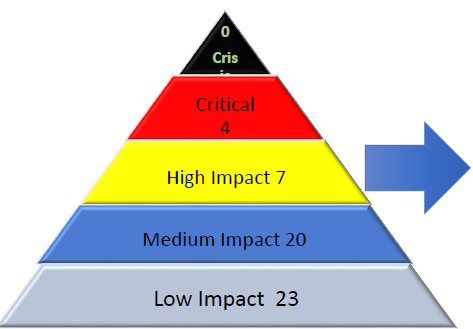
Basically I need to draw Pyramid of Incidents in qlick sense where I will have the number of each type of incidents in certain section of the pyramid (see example below)
Maybe I should add a picture as a background of my table in qlick sense?
Are there any advice on how to make it?
- Mark as New
- Bookmark
- Subscribe
- Mute
- Subscribe to RSS Feed
- Permalink
- Report Inappropriate Content
Dear Natalya,
you can't draw that in "vanilla" Sense, you can create an extension for it.
The pyramid is strictly required? There are many good visual chart for that.
Bar chart is suitable this, but multiple KPI objects will do the work as well.
G.
- Mark as New
- Bookmark
- Subscribe
- Mute
- Subscribe to RSS Feed
- Permalink
- Report Inappropriate Content
Hi Natalya,
Gabor is correct - You can't do this in the "vanilla" sense but you can manipulate a bar chart or use a extension.
Doing an image overlay is simple enough in QlikView but I cant see an easy option in Qlik Sense
However, you could try this very "Old Skool" solution 
You could create 5 images (one for each layer) using a tool such as gimp or create them in word/powerpoint and use a snipping tool to save them.
Save them in your graphics/media library (if your using QS desktop I think the path is: \documents\qlik\sense\content\default).
Then drag a text object onto your document with the relevant image set as the background and the text set as your expression (='Crisis '&Whatever your expression is) .
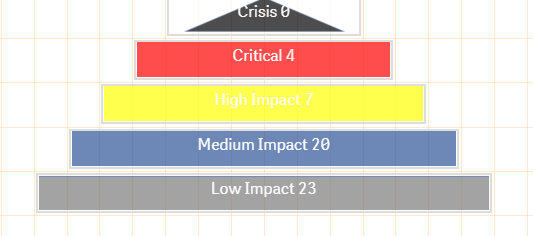
I'm certain there are better ways to do it but it's just an idea 
Regards
Craig