Unlock a world of possibilities! Login now and discover the exclusive benefits awaiting you.
- Qlik Community
- :
- Forums
- :
- Analytics
- :
- New to Qlik Analytics
- :
- Create a top 10 table from an already loaded excel...
- Subscribe to RSS Feed
- Mark Topic as New
- Mark Topic as Read
- Float this Topic for Current User
- Bookmark
- Subscribe
- Mute
- Printer Friendly Page
- Mark as New
- Bookmark
- Subscribe
- Mute
- Subscribe to RSS Feed
- Permalink
- Report Inappropriate Content
Create a top 10 table from an already loaded excel file
Hi,
I am coming from MS PowerBI so I am not sure how to handle this in sense. This is my DAX script:
Top 10 Interest Areas = TOPN(10,SUMMARIZE('Individual Practice Area','Individual Practice Area'[Interest Area Id Desc Long],"Count", DISTINCTCOUNT('Individual Practice Area'[Indv Id])),[Count],DESC)
I tried everything from creating this visually on the chart and using the Data Load Editor.
Can this be achieved through the Visualization tool? if not, how can we accomplish the same result using Sense scripting language?
Thanks,
Fahd
Accepted Solutions
- Mark as New
- Bookmark
- Subscribe
- Mute
- Subscribe to RSS Feed
- Permalink
- Report Inappropriate Content
Hello,
check this video to limit dimension to top 10
http://help.qlik.com/en-US/sense/2.2/Content/Videos/Videos-dimensions-limitations.htm?q=limitation
Regards
- Mark as New
- Bookmark
- Subscribe
- Mute
- Subscribe to RSS Feed
- Permalink
- Report Inappropriate Content
Hello,
check this video to limit dimension to top 10
http://help.qlik.com/en-US/sense/2.2/Content/Videos/Videos-dimensions-limitations.htm?q=limitation
Regards
- Mark as New
- Bookmark
- Subscribe
- Mute
- Subscribe to RSS Feed
- Permalink
- Report Inappropriate Content
If you open the "Consumer Goods Sales" example application that comes with Qlik Sense. Go to the sheet called "Sales Rep Performance" and then click on the EDIT button to inspect how the various tables and charts are set up.
Click on the lower left chart called "Toal Revenue =..." :
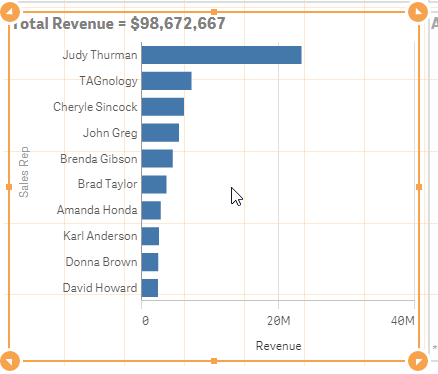
Change the options under the section DATA and Dimension Sales Rep, Click on Limitation and select Fixed Number - click Top and type 10 in the fx input field. Finally you can click DONE to go save your changes.
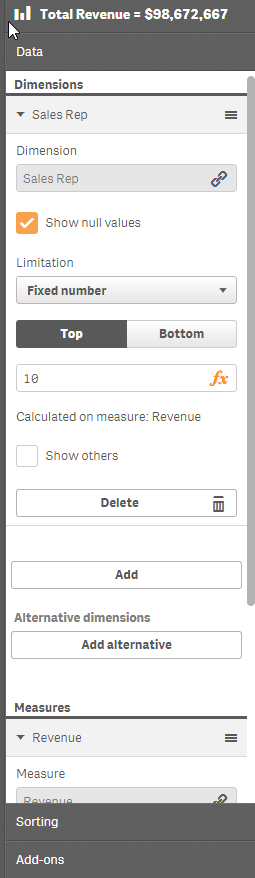
You can select the relevant dimension for your counting and as a measure you would use the Count(DISTINCT .....) function.
- Mark as New
- Bookmark
- Subscribe
- Mute
- Subscribe to RSS Feed
- Permalink
- Report Inappropriate Content
Thank you for concrete scenario. I was able to do the exact same thing using the front end which is great for our business users. However, I am curious how can this be scripted in the data load edit, in case I need to reuse this functionality across different sheets.
Thanks,
Fahd