Unlock a world of possibilities! Login now and discover the exclusive benefits awaiting you.
- Qlik Community
- :
- Forums
- :
- Analytics
- :
- New to Qlik Analytics
- :
- Create a trend chart for employees showing 2 count...
- Subscribe to RSS Feed
- Mark Topic as New
- Mark Topic as Read
- Float this Topic for Current User
- Bookmark
- Subscribe
- Mute
- Printer Friendly Page
- Mark as New
- Bookmark
- Subscribe
- Mute
- Subscribe to RSS Feed
- Permalink
- Report Inappropriate Content
Create a trend chart for employees showing 2 counts
Hi,
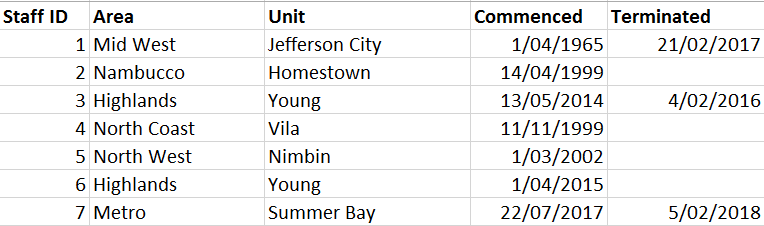
I've been asked to create a rolling trend chart that shows the total counts of employees over time based on the following requirements:
- There are 2 date fields - Commenced, Terminated. These fields are used to determined how and whether they are counted in each period. An employee should be counted in all periods from their Commenced date up until the month in which they terminate. In the month they terminate, they are to be counted as Terminated.
- Time Period can be set to Year, Quarter or Month
- The chart must:
- Show the total number of current employees as at the last day of each time period, and
- Show the total number of employees who terminated within each time period
- Be able to filter both above period totals by Area and Unit
A small snapshot of the dataset looks like this:
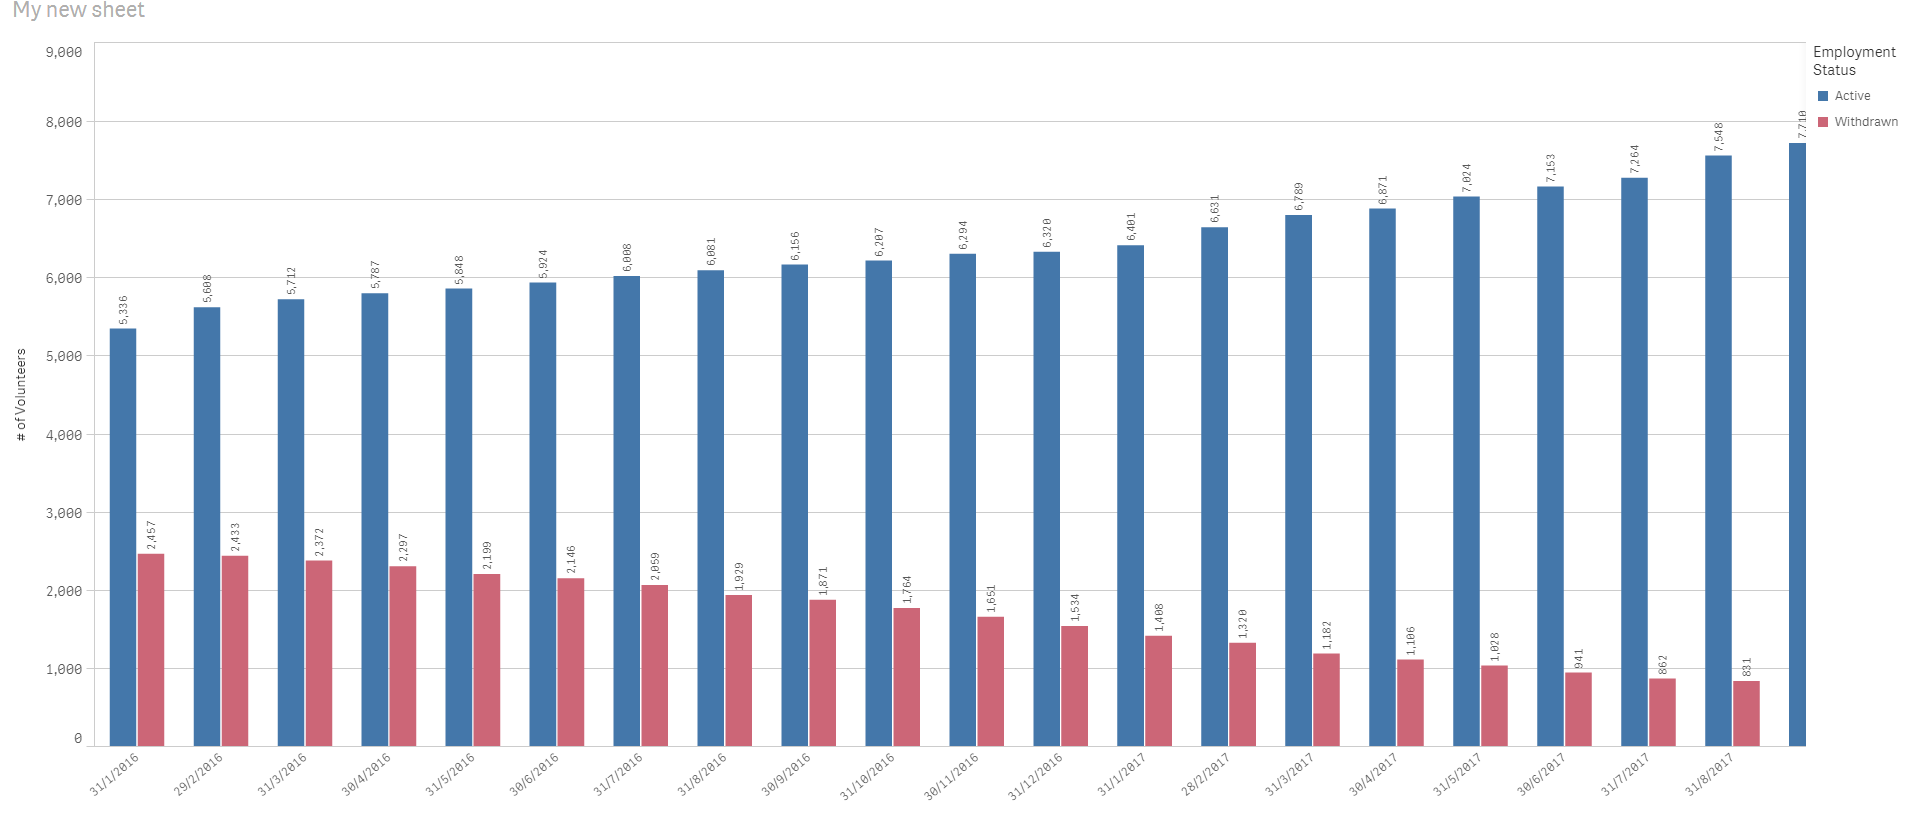
Below is a sample chart that is intended to illustrate what I'm trying to do. The contents are irrelevant and unrelated.
I've tried using interval match, done many searches across the forums, but I'm struggling to understand these concepts for the above complex problem.
Look forward to any assistance you can provide to put me in the right direction.
Thanks kindly,
Ozzie
- Mark as New
- Bookmark
- Subscribe
- Mute
- Subscribe to RSS Feed
- Permalink
- Report Inappropriate Content
I think what you're looking for is this: Creating Reference Dates for Intervals
talk is cheap, supply exceeds demand
- Mark as New
- Bookmark
- Subscribe
- Mute
- Subscribe to RSS Feed
- Permalink
- Report Inappropriate Content
Hi Gysbert,
Thanks kindly for this - I'll check it out and revert.
Take care,
Ozzie