Unlock a world of possibilities! Login now and discover the exclusive benefits awaiting you.
- Qlik Community
- :
- Forums
- :
- Analytics
- :
- New to Qlik Analytics
- :
- Creating Isoquants in Qlik Sense
Options
- Subscribe to RSS Feed
- Mark Topic as New
- Mark Topic as Read
- Float this Topic for Current User
- Bookmark
- Subscribe
- Mute
- Printer Friendly Page
Turn on suggestions
Auto-suggest helps you quickly narrow down your search results by suggesting possible matches as you type.
Showing results for
Anonymous
Not applicable
2018-02-13
04:17 AM
- Mark as New
- Bookmark
- Subscribe
- Mute
- Subscribe to RSS Feed
- Permalink
- Report Inappropriate Content
Creating Isoquants in Qlik Sense
Hi guys,
I am planning to create static isoquants (have a table for successive points to create multiple ones) for showing the interaction between two financial metrics (one on x axis and the other on y axis), with the companies shown as dots (points on the chart). Would anyone have an idea how to go about it? Attaching the one that I created in tableau.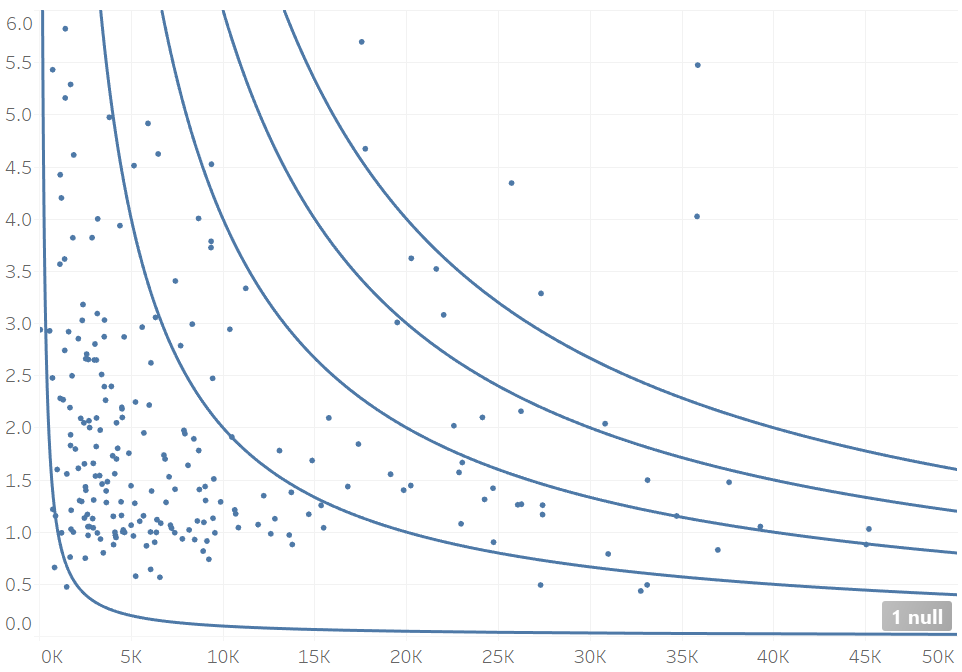
264 Views
1 Reply
Master
2018-02-13
02:37 PM
- Mark as New
- Bookmark
- Subscribe
- Mute
- Subscribe to RSS Feed
- Permalink
- Report Inappropriate Content
I think that the closest you might get to this without an extension is a scatter plot.
198 Views
Community Browser