Unlock a world of possibilities! Login now and discover the exclusive benefits awaiting you.
- Qlik Community
- :
- Forums
- :
- Analytics
- :
- New to Qlik Analytics
- :
- Creating Useful Visualizasions with Claims/Financi...
Options
- Subscribe to RSS Feed
- Mark Topic as New
- Mark Topic as Read
- Float this Topic for Current User
- Bookmark
- Subscribe
- Mute
- Printer Friendly Page
Turn on suggestions
Auto-suggest helps you quickly narrow down your search results by suggesting possible matches as you type.
Showing results for
Contributor
2018-12-05
06:31 AM
- Mark as New
- Bookmark
- Subscribe
- Mute
- Subscribe to RSS Feed
- Permalink
- Report Inappropriate Content
Creating Useful Visualizasions with Claims/Financial Data
Can somebody please assist with this Please?
Use the Claims data to provide useful views. The links contains no bugs...
Please see Claims data: https://drive.google.com/file/d/1zK6Wh_oscH_geI3cbfKDzu8usDaZpbaV/view?usp=sharing
https://drive.google.com/file/d/1CGfOuscT6OUlVoG9f1Ine94xQzmKBHMU/view?usp=sharing
https://drive.google.com/file/d/1Aw-7BJpIxo95h-yv_GlciffKebUx02SD/view?usp=sharing
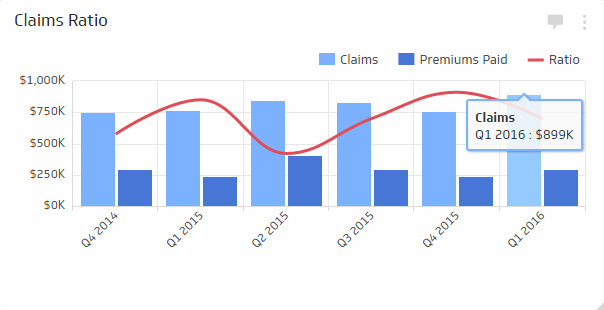
There are not clear defined KPI's and more structured data according to me to create something/dashboard like attached please assist? In Qlikview/Qliksense
403 Views
1 Reply
Anonymous
Not applicable
2018-12-05
08:36 AM
- Mark as New
- Bookmark
- Subscribe
- Mute
- Subscribe to RSS Feed
- Permalink
- Report Inappropriate Content
These links might help you start:
https://www.business-case-analysis.com/financial-metrics.html
https://guidingmetrics.com/content/insurance-industrys-18-most-critical-metrics/
Or if you're able to outsource this, I can help too! message me!
https://www.business-case-analysis.com/financial-metrics.html
https://guidingmetrics.com/content/insurance-industrys-18-most-critical-metrics/
Or if you're able to outsource this, I can help too! message me!
391 Views
Community Browser