Unlock a world of possibilities! Login now and discover the exclusive benefits awaiting you.
- Qlik Community
- :
- Forums
- :
- Analytics
- :
- New to Qlik Analytics
- :
- Re: Creating aggregated dimension from another dim...
- Subscribe to RSS Feed
- Mark Topic as New
- Mark Topic as Read
- Float this Topic for Current User
- Bookmark
- Subscribe
- Mute
- Printer Friendly Page
- Mark as New
- Bookmark
- Subscribe
- Mute
- Subscribe to RSS Feed
- Permalink
- Report Inappropriate Content
Creating aggregated dimension from another dimension
Hi all,
Need urgent help on this one.
Lets say i have data in the below form :
| items | Week | Sales |
| a | 1 | 200 |
| a | 2 | 300 |
| a | 3 | 400 |
| b | 1 | 100 |
| b | 2 | 250 |
| b | 4 | 250 |
| c | 1 | 100 |
| c | 2 | 100 |
From this data i need to create a table which should be like this.
| Field Required | Sum(Sales) |
| only a | 900 |
| only b | 600 |
| both a & b | 850 |
| neither a nor b | 200 |
The 'Field Required' needs to be aggregated on weeks & items.
ex, In the required table 'only a' should have weeks which are present only in a i.e.,weeks 1,2,3 of a.
similar for 'only b'.
'both a & b' should have weeks which are common in a & b i.e., weeks 1 & 2 of both a & b.
likewise for 'neither a nor b', weeks without a & b should be present, i.e., c in this case .
Currently i'm using the below expression for the Field Required:
=if(Aggr(items = 'a',WEEK,items),'only a',
if(Aggr(items = 'b',WEEK,items),'only b',
if(Aggr(items = 'a' and items = 'b',WEEK,items),'both a & b',
if(Aggr(items <> 'a' and items <> 'b',WEEK,items),'neither a nor b'))))
With this i'm able to get only a & only b, but unable to get the other 2.
Any help on this would be great.
Accepted Solutions
- Mark as New
- Bookmark
- Subscribe
- Mute
- Subscribe to RSS Feed
- Permalink
- Report Inappropriate Content
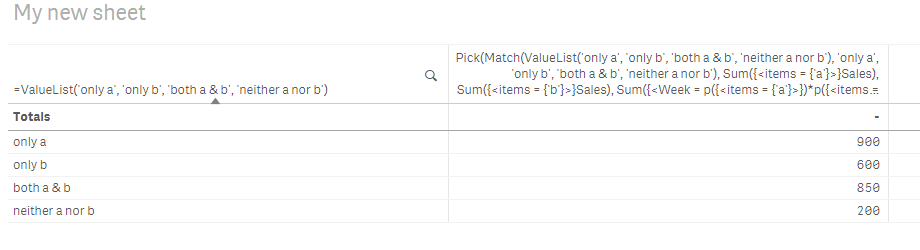
May be try this
Pick(Match(ValueList('only a', 'only b', 'both a & b', 'neither a nor b'), 'only a', 'only b', 'both a & b', 'neither a nor b'),
Sum({<items = {'a'}>}Sales),
Sum({<items = {'b'}>}Sales),
Sum({<Week = p({<items = {'a'}>})*p({<items = {'b'}>}), items = {'a', 'b'}>}Sales),
Sum({<items -= {'a', 'b'}>}Sales))
/
RangeMin(
Sum({<items = {'a'}>}Sales),
Sum({<items = {'b'}>}Sales),
Sum({<Week = p({<items = {'a'}>})*p({<items = {'b'}>}), items = {'a', 'b'}>}Sales),
Sum({<items -= {'a', 'b'}>}Sales))
- Mark as New
- Bookmark
- Subscribe
- Mute
- Subscribe to RSS Feed
- Permalink
- Report Inappropriate Content
This?
- Mark as New
- Bookmark
- Subscribe
- Mute
- Subscribe to RSS Feed
- Permalink
- Report Inappropriate Content
You could also have each measure separately in a Pivot Table like this:
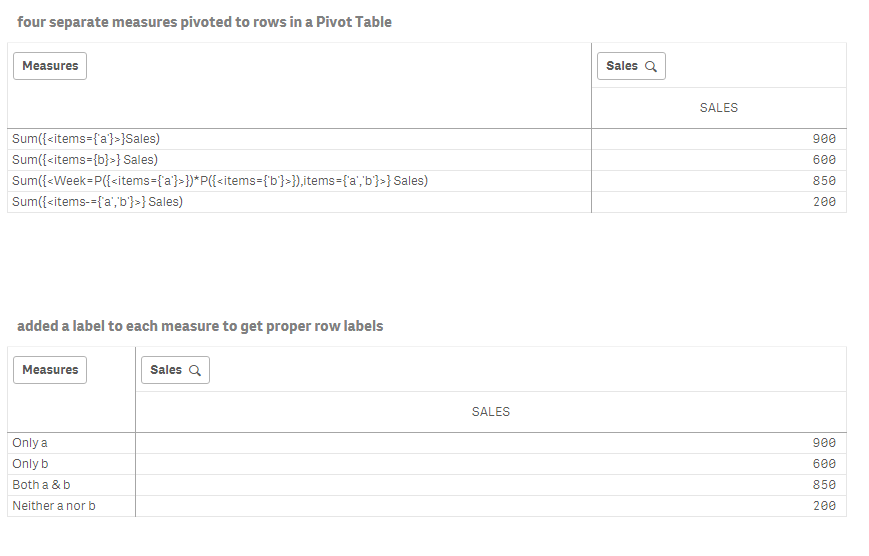
You simply add a dimension ='SALES' with the label Sales then you add the four measures as you can see in the first table above. After that you put the dimension on a column and the measures as rows in a Pivot Table.
- Mark as New
- Bookmark
- Subscribe
- Mute
- Subscribe to RSS Feed
- Permalink
- Report Inappropriate Content
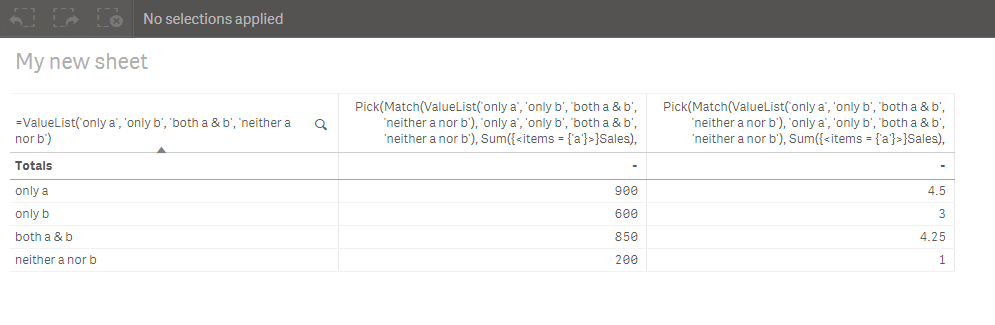
Sunny,
Thanks for your help, this does work. Need to add one more column. which would take the minimum of the derived sales and divide it to the individual sales. ex: only a would become 4.5 (900/200) & likewise for others. Trying to figure out how do we get the minimum sales from here.
- Mark as New
- Bookmark
- Subscribe
- Mute
- Subscribe to RSS Feed
- Permalink
- Report Inappropriate Content
May be try this
Pick(Match(ValueList('only a', 'only b', 'both a & b', 'neither a nor b'), 'only a', 'only b', 'both a & b', 'neither a nor b'),
Sum({<items = {'a'}>}Sales),
Sum({<items = {'b'}>}Sales),
Sum({<Week = p({<items = {'a'}>})*p({<items = {'b'}>}), items = {'a', 'b'}>}Sales),
Sum({<items -= {'a', 'b'}>}Sales))
/
RangeMin(
Sum({<items = {'a'}>}Sales),
Sum({<items = {'b'}>}Sales),
Sum({<Week = p({<items = {'a'}>})*p({<items = {'b'}>}), items = {'a', 'b'}>}Sales),
Sum({<items -= {'a', 'b'}>}Sales))
- Mark as New
- Bookmark
- Subscribe
- Mute
- Subscribe to RSS Feed
- Permalink
- Report Inappropriate Content
Thanks so much, this works perfectly.