Unlock a world of possibilities! Login now and discover the exclusive benefits awaiting you.
- Qlik Community
- :
- Forums
- :
- Analytics
- :
- New to Qlik Analytics
- :
- Creating crosstab chart on Qlik Sense
- Subscribe to RSS Feed
- Mark Topic as New
- Mark Topic as Read
- Float this Topic for Current User
- Bookmark
- Subscribe
- Mute
- Printer Friendly Page
- Mark as New
- Bookmark
- Subscribe
- Mute
- Subscribe to RSS Feed
- Permalink
- Report Inappropriate Content
Creating crosstab chart on Qlik Sense
Hello all,
I am new on Qlik and I am stuck on a chart that I thought would be easy to create:
I need the rows on my cross table to be sum of fields (each row a sum of a Boolean field (0/1) of my data set) and the columns are subsets of the data set over where the sum needs to happen. I have a flat data set with several fields, but as an example of the few I need for this summary cross tab:
bo_admitflag bo_enrolledflag date_admit enroll_year
1 1 12.01.2015 2016
.....
the rows and columns on the cross tables would be
Row 201x EOY Admits 201x EOY Enrolled 201x YTD Admits
sum(bo_admitflag) for previous EOF sum(enrolledflag) for previous EOY Sum(bo_admitflag) for YTD .
sum(bo_admitflag)
sum(bo_enrolledflag)
....
The EOY will be all prior to current year selected and for the YTD, the sum has to be up to the current day and the year in question; the last columns on this chart will be for the current year and current date.
See attached image of the kind of cross table I need.
The Qlik Sense desktop table chart allows me to create the aggregate functions but there are only columns on it; The pivot chart does not allow me to create aggregation expression as row only measures.
Thanks, Alice
- « Previous Replies
- Next Replies »
Accepted Solutions
- Mark as New
- Bookmark
- Subscribe
- Mute
- Subscribe to RSS Feed
- Permalink
- Report Inappropriate Content
Hi,
So here is the approach you can move forward.
Take one calculated dimension as -
=Valuelist('Students','Gross Deposits','Withdrawn Deposits','Net Deposits')
and write all your expressions as ( This is just a sample for 2016 EOY Admits)-
Pick(Match(Valuelist('Students','Gross Deposits','Withdrawn Deposits','Net Deposits'),
'Students','Gross Deposits','Withdrawn Deposits','Net Deposits'),
Sum({<[Enroll_Year] = {2016}>} bo_admitflag),<Exp for Gross deposits>,<Exp for With Deposts>....just like that)
So for each column you will write one statment like above. If you need more rows, you need to add value in your valuelist dimension.
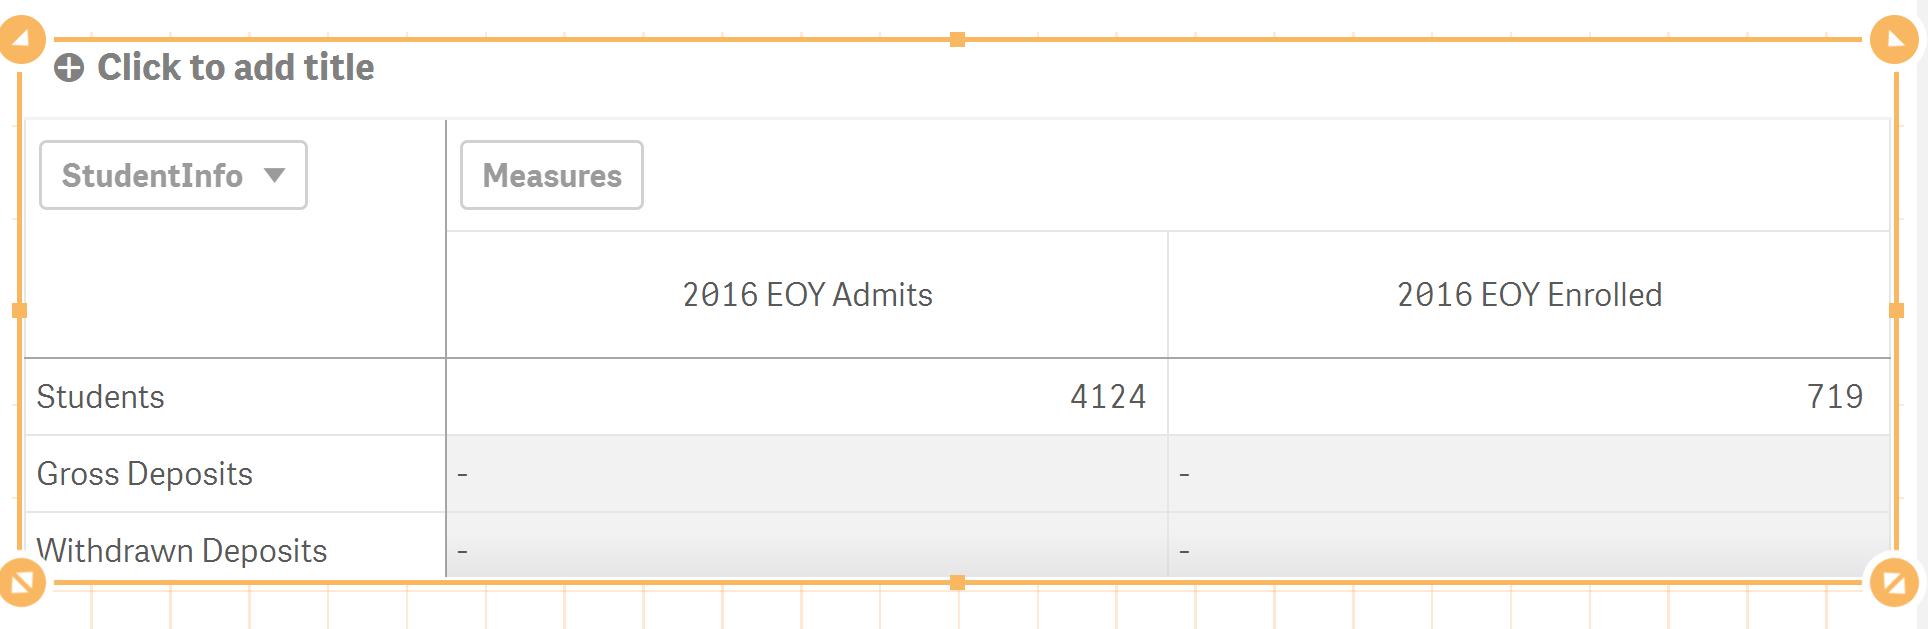
It will appear as below -
Let me know if you are not able to proceed.
Thanks,
- Mark as New
- Bookmark
- Subscribe
- Mute
- Subscribe to RSS Feed
- Permalink
- Report Inappropriate Content
Looks quite complex, if you can share sample data and expected output, I can try on this. Its difficult to try something with attached image.
- Mark as New
- Bookmark
- Subscribe
- Mute
- Subscribe to RSS Feed
- Permalink
- Report Inappropriate Content
Hi, Is your number ending 7729 a cell #. I have texted you a message. Can you reply it.
- Mark as New
- Bookmark
- Subscribe
- Mute
- Subscribe to RSS Feed
- Permalink
- Report Inappropriate Content
Hello Digvijay,
The expected outcome is the image attached;it is a web site graph, so I am attaching the export to excell (mirror of the image); I am also attaching the app file where tracking is the cross tab chart I am trying to create. but not correct;
I so appreciate your help. I have another chart that I am struggling with (Qlik idea one), I can explain that to you later.
Thank you,
Alice
- Mark as New
- Bookmark
- Subscribe
- Mute
- Subscribe to RSS Feed
- Permalink
- Report Inappropriate Content
Hi,
So here is the approach you can move forward.
Take one calculated dimension as -
=Valuelist('Students','Gross Deposits','Withdrawn Deposits','Net Deposits')
and write all your expressions as ( This is just a sample for 2016 EOY Admits)-
Pick(Match(Valuelist('Students','Gross Deposits','Withdrawn Deposits','Net Deposits'),
'Students','Gross Deposits','Withdrawn Deposits','Net Deposits'),
Sum({<[Enroll_Year] = {2016}>} bo_admitflag),<Exp for Gross deposits>,<Exp for With Deposts>....just like that)
So for each column you will write one statment like above. If you need more rows, you need to add value in your valuelist dimension.
It will appear as below -
Let me know if you are not able to proceed.
Thanks,
- Mark as New
- Bookmark
- Subscribe
- Mute
- Subscribe to RSS Feed
- Permalink
- Report Inappropriate Content
I see one of your new message in my mail box but don't see it here, strange.
This is what I see in new mail message -
********
Digvjay,
When I create the measure column with the Pick expression, even though there is no error on the editor window when i hit apply, the invalid dimension shows up on the sheet TrackingCom.
Thank you so much for your help, I appreciate it.
Alice
**************
See the updated file where I was trying this, I think you should be able to find what is causing this after comparing with my pick expression.
- Mark as New
- Bookmark
- Subscribe
- Mute
- Subscribe to RSS Feed
- Permalink
- Report Inappropriate Content
Thanks,
I deleted my post, because I figured out if I created as a measure, it worked and translated into a column. Now I am struggling with the expressions;
One is that I dont want to hard code the year of enrollment on the expression, but let it be what the user(EU) picks up; the EU could choose 2 or 3 years to see the comparisons;
Two is that my Year to date (YTD) column will have to factor the system date(day). How do I do that?
Thanks again,
Alice
- Mark as New
- Bookmark
- Subscribe
- Mute
- Subscribe to RSS Feed
- Permalink
- Report Inappropriate Content
I thought you closed the whole thread as you marked your own post as answered. 
You don't need to hard code the year, I just did it in sample, you should use {<Enroll_Year={$(=Max(Enroll_Year))}>}
set expression for max year and {<Enroll_Year={$(=Max(Enroll_Year)-1)}>} as previous year. So your selected year will be max year and selected year - 1 will be the previous year. If no year is selected then maximum year of your data will be the max year.
For YTD, usually we use Yeartodate function to set the flag field in script to avoid this calculation in front end as it slows down the chart loading a bit ,but you can use this in front end also and can observe the performance -
Something like this in set expression
{Your date field={"=Yeartodate(Yourdate)=-1"}>}
Also keep in mind there is always a '=' sign between set expression field and element list. I think I saw '>=' somewhere.
Let me know if you are not able to proceed.
- Mark as New
- Bookmark
- Subscribe
- Mute
- Subscribe to RSS Feed
- Permalink
- Report Inappropriate Content
There are other parameters in yeartodate function to handle situations in case your YTD month starts from other than January.
'Qlikview 11 for developers' is a great book to understand point in time reporting concepts. Most of the functions and scripting techniques are applicable to both Qlikview and Qliksense.
- Mark as New
- Bookmark
- Subscribe
- Mute
- Subscribe to RSS Feed
- Permalink
- Report Inappropriate Content
Thank you Digvijay,
I am not finding the online documentation (pdf guides) to be very helpful; A very brief and basic syntax with no good example or very basic ones to go with them.
I am closing this thread and if I have a question with the YTD function without an asnwer, I create another thread.
Any other books you recomend for beginners who are trying to learn the systax and the power of Qlik lingo?
Alice
- « Previous Replies
- Next Replies »