Unlock a world of possibilities! Login now and discover the exclusive benefits awaiting you.
- Qlik Community
- :
- Forums
- :
- Analytics
- :
- New to Qlik Analytics
- :
- Re: Creating legend names for the bar charts which...
- Subscribe to RSS Feed
- Mark Topic as New
- Mark Topic as Read
- Float this Topic for Current User
- Bookmark
- Subscribe
- Mute
- Printer Friendly Page
- Mark as New
- Bookmark
- Subscribe
- Mute
- Subscribe to RSS Feed
- Permalink
- Report Inappropriate Content
Creating legend names for the bar charts which is generated through expression
Hello All
I have bar chart which is having dynamic dimensions and which i have customized color combinations(which i did through colormix2 formula),,,
The problem here is qliksense wouldn't support if i generate the chart using expression in colors and legend section.
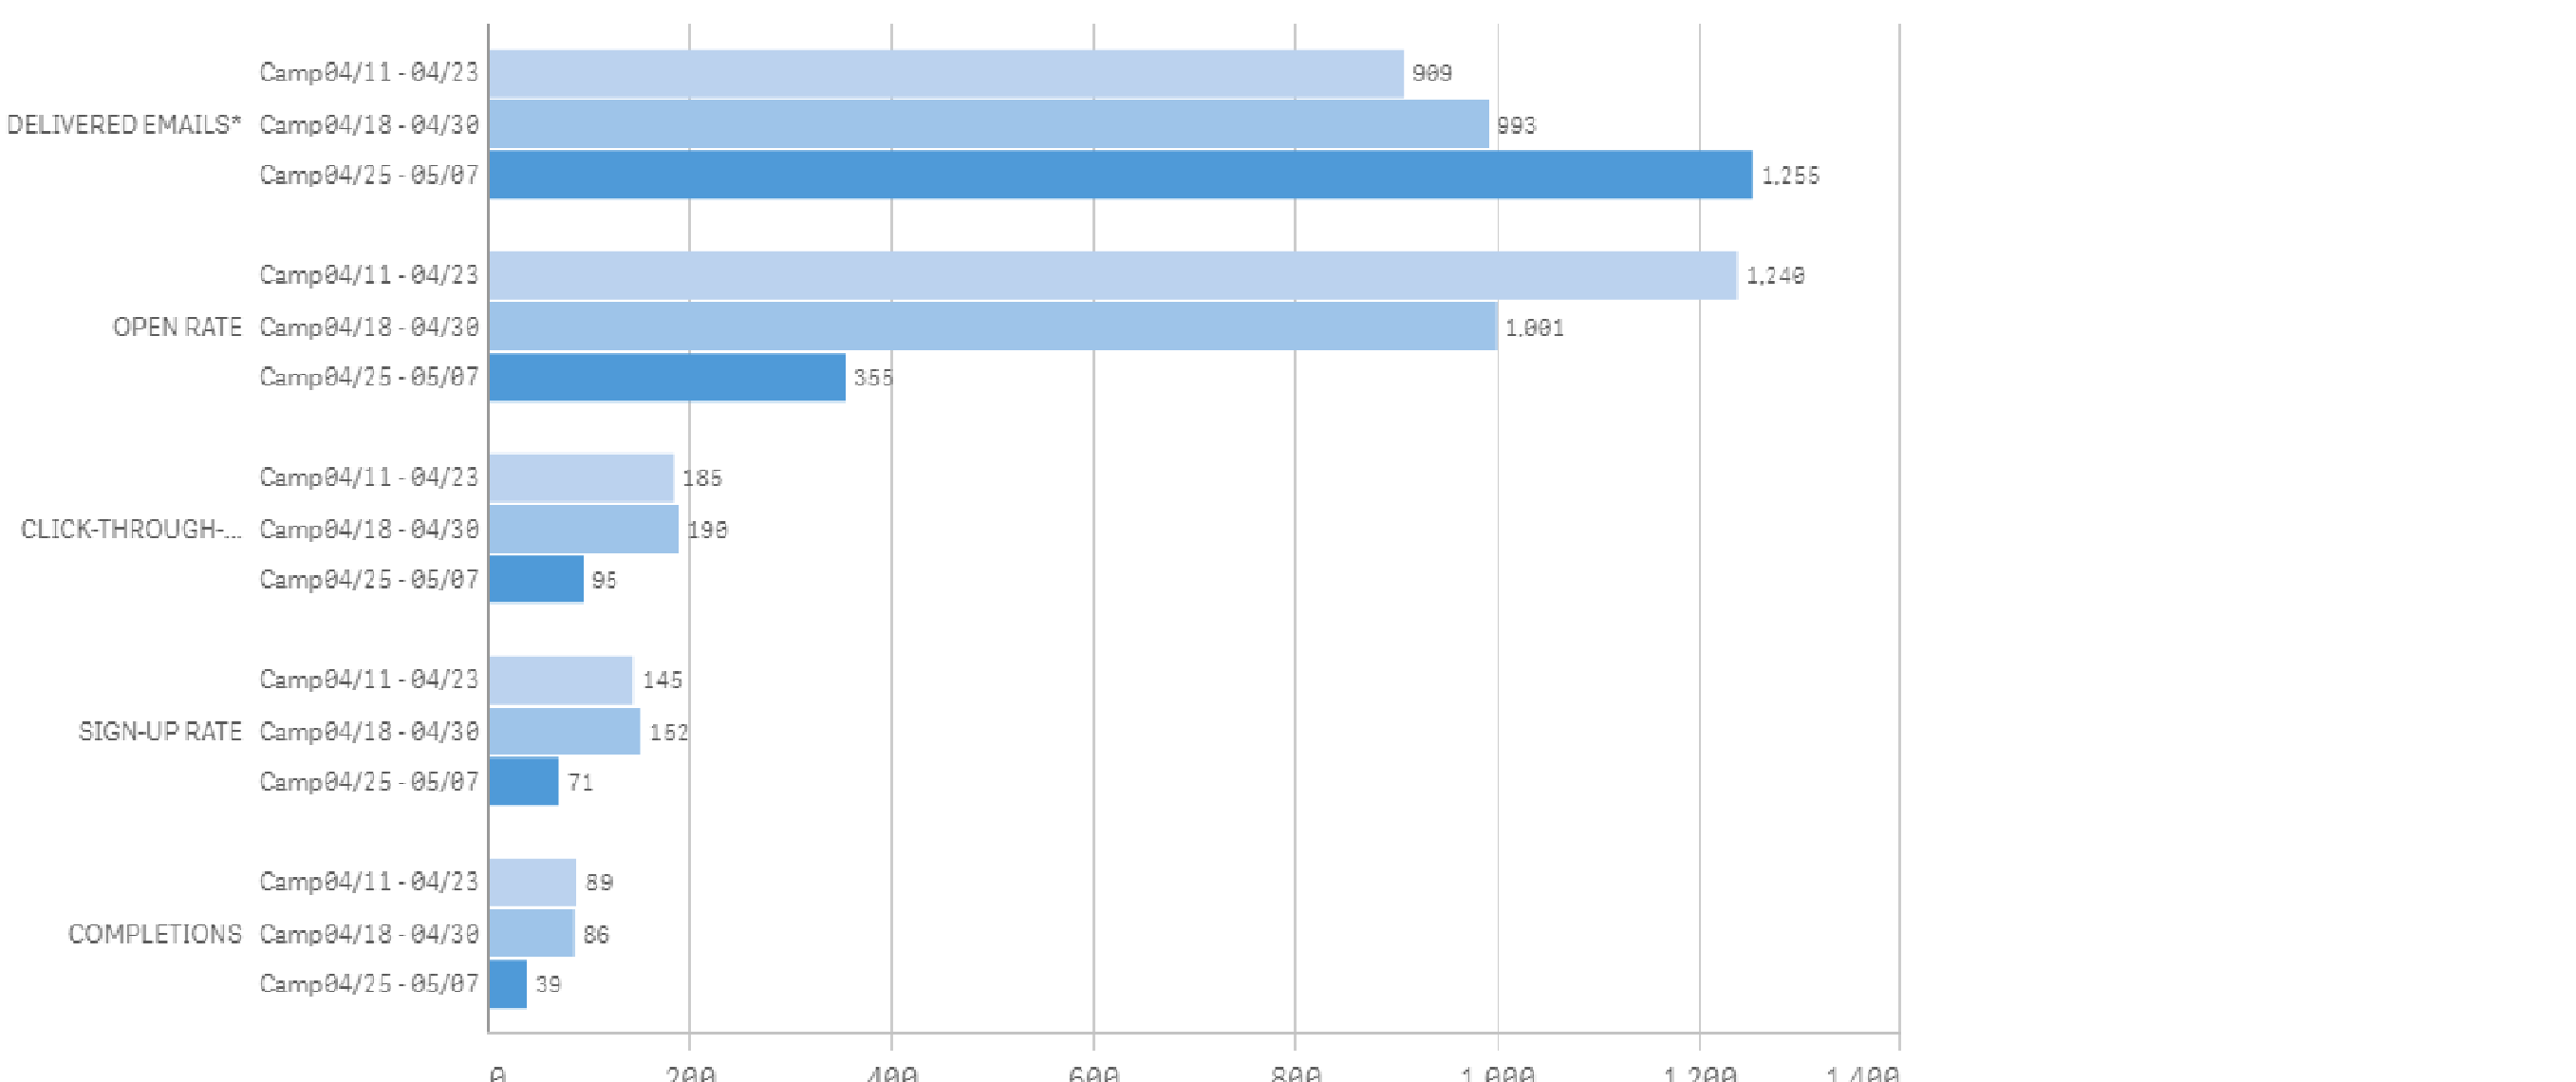
Here i need legend names for:
Camp 4/11-4/23
Camp 4/18-4/30
Camp 4/25-5/07
But legend names should be dynamic,,because Camp Dates keeps changing,,is there any way to generate legend names.
Best Regards.
- Mark as New
- Bookmark
- Subscribe
- Mute
- Subscribe to RSS Feed
- Permalink
- Report Inappropriate Content
Hi,
Help me understand what are you trying to achieve.
- From attached picture you want to:
- remove Camp 4/18-4/30,Camp 4/25-5/07 etc and instead have a small ledgend describing a color
Would it be acceptable if you would have this legend on one of the bars? (for example nest to the values on bars?)
If yes, than we could use concat & dual functions and get the labels placed on top of biggest bars.
cheers
Lech
- Mark as New
- Bookmark
- Subscribe
- Mute
- Subscribe to RSS Feed
- Permalink
- Report Inappropriate Content
No i'm trying to say,i need legend labels to be displayed at bottom wrt to 3 campaigns(with specified color)
- Mark as New
- Bookmark
- Subscribe
- Mute
- Subscribe to RSS Feed
- Permalink
- Report Inappropriate Content
Like we do in normal bar charts, we'll get automatically legend names if we use auto as a color, but here i have colored it through expressions.
- Mark as New
- Bookmark
- Subscribe
- Mute
- Subscribe to RSS Feed
- Permalink
- Report Inappropriate Content
Sorry - my bad - i got it wrong...
Well,
I guess there is no way to achieve this using out of the box charts. Extensions may help you solve this, but i know it is not ideal..
regards
L.
- Mark as New
- Bookmark
- Subscribe
- Mute
- Subscribe to RSS Feed
- Permalink
- Report Inappropriate Content
That's not automtically possible, but what I would suggest is creating a table:
As a dimension:
ValueList('yourperiod1','yourperiod2'..) //name your periods as you want
As measure:
='██████████'
as text expression,
sthing like this:
=if(ValueList('period1','period2')='period1',rgb(0,112,200),Red()) //choose your colours;
the result would be:
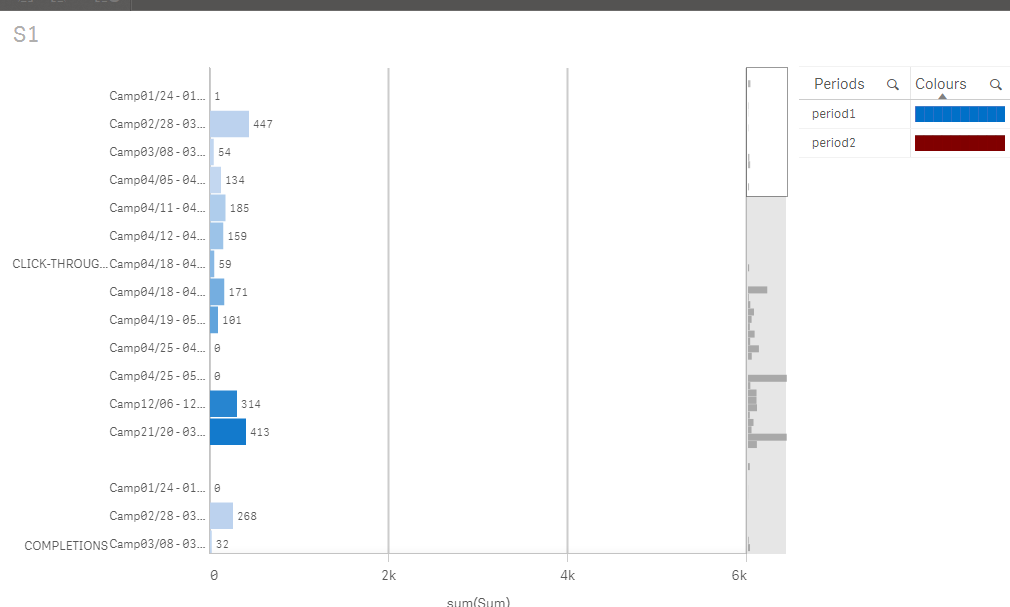
You can even use your period dimension: campaign.. as a dimension if you want to show colours of all your periods,
and as a text colour, if (compaign='camp04...',red(), if(...))
Hope this helps !
- Mark as New
- Bookmark
- Subscribe
- Mute
- Subscribe to RSS Feed
- Permalink
- Report Inappropriate Content
Thank you,,,,