Unlock a world of possibilities! Login now and discover the exclusive benefits awaiting you.
- Qlik Community
- :
- Forums
- :
- Analytics
- :
- New to Qlik Analytics
- :
- Re: Crosstable load with different data types
- Subscribe to RSS Feed
- Mark Topic as New
- Mark Topic as Read
- Float this Topic for Current User
- Bookmark
- Subscribe
- Mute
- Printer Friendly Page
- Mark as New
- Bookmark
- Subscribe
- Mute
- Subscribe to RSS Feed
- Permalink
- Report Inappropriate Content
Crosstable load with different data types
Hello all. I have a question regarding how to approach this load. I have a CSV that has information for 2015 and 2016. I am unable to make changes to and have approached this using a cross table load. The problem is the data for the crosstable has two different data type similar to the structure found below.
| ID | Location | Practice | Rate | Jan 2016 | Feb 2016 | Mar 2016 | Jan 2016 | Feb 2016 | Mar 2016 |
|---|---|---|---|---|---|---|---|---|---|
| 1 | NA | Finance | $200 | 1 | 5 | 10 | $30 | $90 | 150$ |
| 2 | NA | Sales | $40 | 0 | 20 | 0 | $0 | $1800 | 90$ |
Now I have tried using crosstables to make (Months, Hours) and use a master calender to populate missing dates but I am unable to use the data values it correctly as the currency value gets factored in along with the hours so each month has a combined data value. The second set of 2016 dates has currency data that is ( Rate x Hour ) so would it be possible to load all the hours and calculate to populate a table after ?
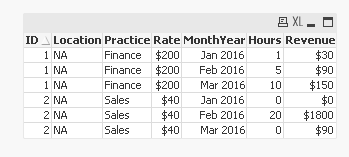
If it makes it easier, I wish to have my data in this type of manner to create visualizations off as I think this would make it easiest to work with compared to the form it is now.
| ID | Location | Practice | Rate | Month | Hours | Revenue |
|---|---|---|---|---|---|---|
| 1 | NA | Finance | $200 | Jan 2016 | 1 | $30 |
| 1 | NA | Finance | $200 | Feb 2016 | 5 | $90 |
| 1 | NA | Finance | $200 | Mar 2016 | 10 | $150 |
| 2 | NA | Sales | $40 | Jan 2016 | 0 | $0 |
- Mark as New
- Bookmark
- Subscribe
- Mute
- Subscribe to RSS Feed
- Permalink
- Report Inappropriate Content
May be like this:
Hour:
CrossTable(MonthYear, Hours, 4)
LOAD ID,
Location,
Practice,
Rate,
[Jan 2016],
[Feb 2016],
[Mar 2016]
FROM
[https://community.qlik.com/thread/239161]
(html, codepage is 1252, embedded labels, table is @1);
FinalTable:
NoConcatenate
LOAD ID,
Location,
Practice,
Rate,
Date(MonthStart(Date#(MonthYear, 'MMM YYYY')), 'MMM YYYY') as MonthYear,
Hours
Resident Hour;
DROP Table Hour;
Revenue:
CrossTable(MonthYear, Revenue, 4)
LOAD ID,
Location,
Practice,
Rate,
[Jan 20161],
[Feb 20161],
[Mar 20161]
FROM
[https://community.qlik.com/thread/239161]
(html, codepage is 1252, embedded labels, table is @1);
Left Join (FinalTable)
LOAD ID,
Location,
Practice,
Rate,
Date(MonthStart(Date#(Left(MonthYear, 8), 'MMM YYYY')), 'MMM YYYY') as MonthYear,
Money(PurgeChar(Revenue, '$'), '$#,##0') as Revenue
Resident Revenue;
DROP Table Revenue;
- Mark as New
- Bookmark
- Subscribe
- Mute
- Subscribe to RSS Feed
- Permalink
- Report Inappropriate Content
Thank you for your response Sunny! I tried using the syntax you described but was unable to get the revenue data to display properly. When using the dimension in visualizations it is representative of 0. Attached is the qlik sense file I've been working on so far, it might provide the community with a better idea of my app. Any help is appreciated while I continue to work on this problem, thanks.
- Mark as New
- Bookmark
- Subscribe
- Mute
- Subscribe to RSS Feed
- Permalink
- Report Inappropriate Content
Can you share the Excel file you used to upload it into the application?
- Mark as New
- Bookmark
- Subscribe
- Mute
- Subscribe to RSS Feed
- Permalink
- Report Inappropriate Content
Yes here is the excel file, excluding sensitive information.