Unlock a world of possibilities! Login now and discover the exclusive benefits awaiting you.
- Qlik Community
- :
- Forums
- :
- Analytics
- :
- New to Qlik Analytics
- :
- Cumulative Sum when a condition is met (Qlik sense...
- Subscribe to RSS Feed
- Mark Topic as New
- Mark Topic as Read
- Float this Topic for Current User
- Bookmark
- Subscribe
- Mute
- Printer Friendly Page
- Mark as New
- Bookmark
- Subscribe
- Mute
- Subscribe to RSS Feed
- Permalink
- Report Inappropriate Content
Cumulative Sum when a condition is met (Qlik sense)
Dear all,
As may be seen below, we have data of revenue in different cities of Spain and different weeks, coming from different industries. (It's not the real data set, it's just an example)
City Week Industry Revenue
Barcelona 1 Finance 375
Barcelona 1 Logistics 407
Barcelona 2 Finance 375
Barcelona 2 Logistics 407
Barcelona 3 Finance 475
Barcelona 3 Logistics 507
Madrid 1 Finance 280
Madrid 1 Logistics 310
Madrid 2 Finance 290
Madrid 2 Logistics 295
Madrid 3 Finance 290
Madrid 3 Logistics 295
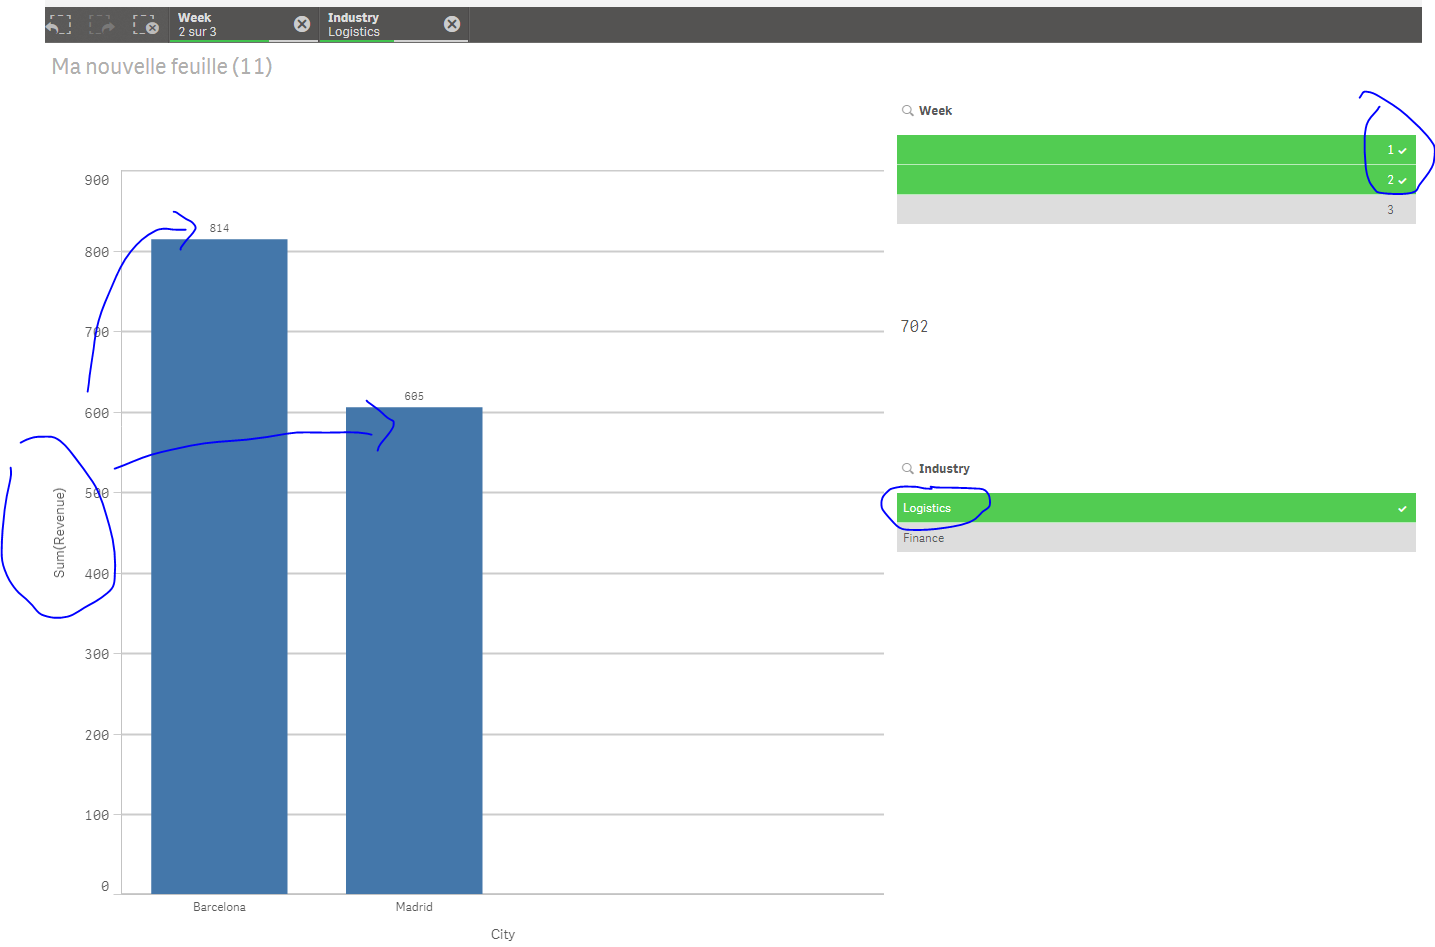
I have a filter with the Week values. I need to create the following combo chart in qlik sense (all the measures will be displayed as bar charts). As dimension I will have City. One measure should be the cumulative sum (from the first to the maximum week selected on the filter) of revenue in Finance industry and the other measure in Logistics.
On the one hand, I am able to calculate the cumulative sum considering both industries together
( =Sum({$<Week={"<=$(=Max(Week))"}>}[Revenue]}).
On the other hand, I am able to calculate the sum of revenue for each industry
( =Sum({$<Industry={"Logistics"}>}[Revenue]}).
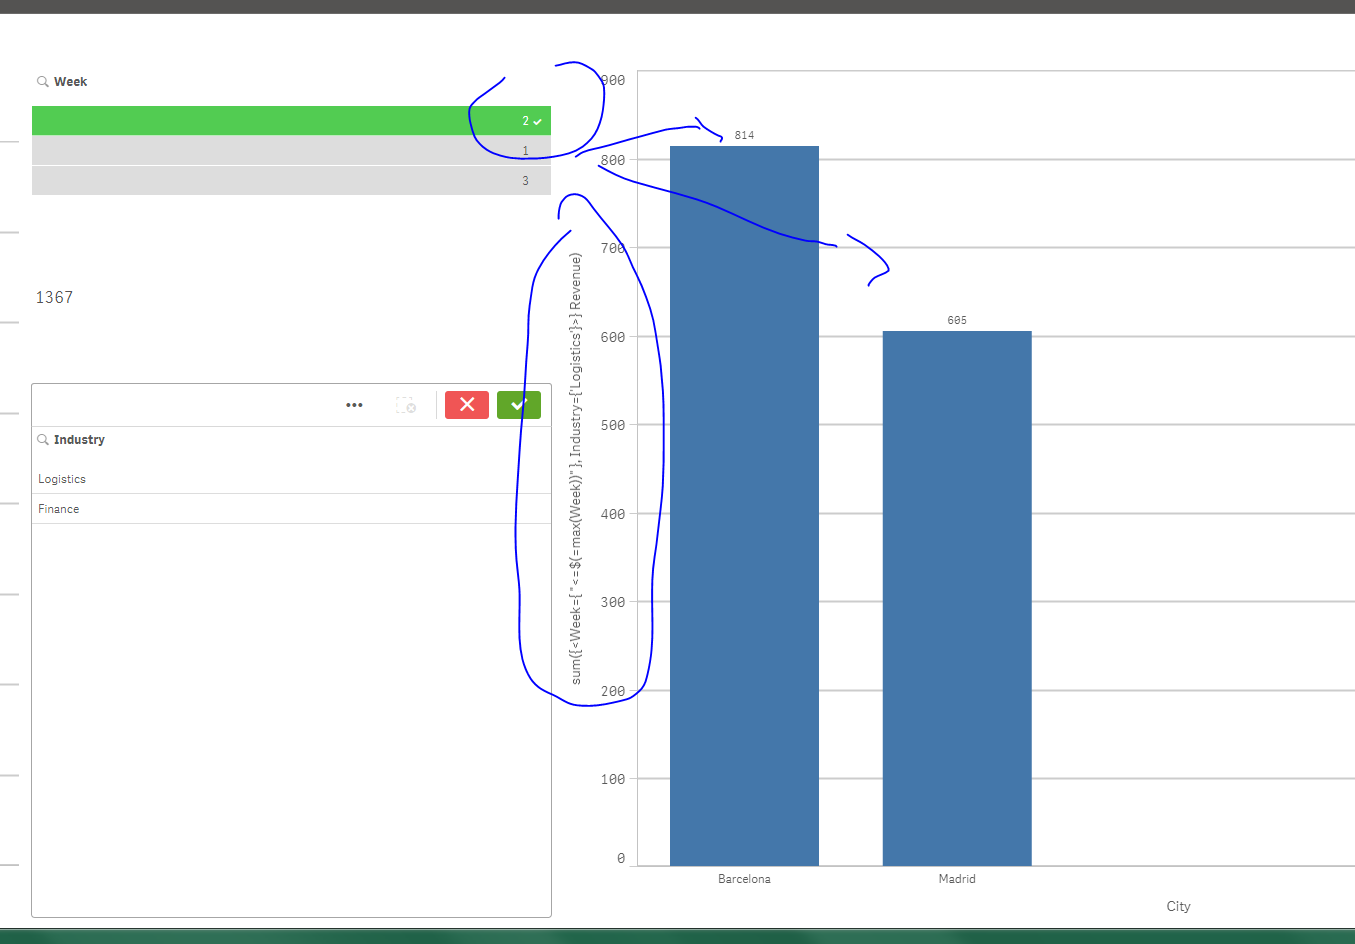
I think the solution should be similar to the following code but it does not work:
( =Sum({$<Week={"<=$(=Max(Week))"},Industry={"Logistics"}>}[Revenue]}).
Just as notes:
* Week field is an integer ranging from 1 to 3. It does not come from a date field.
* I cannot use another filter for Industry field because I would like to display the sum of Revenue for each industry separately at any time.
* I have tried to create a calculated field on the Data Manager (Revenue only for Logistics for example) but at the end I'm not obtaining the desired result. In addition, it might not be very efficient with much information. I would like to achieve it only with Set Analysis.
I would really appreciate if anyone could help me solve this issue. Thank you very much in advance.
Best regards,
Gonzalo
- Tags:
- in qliksense
Accepted Solutions
- Mark as New
- Bookmark
- Subscribe
- Mute
- Subscribe to RSS Feed
- Permalink
- Report Inappropriate Content
Try :
sum({<Week={ "<=$(=max(Week))" }, Industry={'Logistics'}>} Revenue)
I just deleted the last } after Revenue ;
ur expression was like
=Sum({$<Week={"<=$(=Max(Week))"},Industry={"Logistics"}>}[Revenue] } )
=
- Mark as New
- Bookmark
- Subscribe
- Mute
- Subscribe to RSS Feed
- Permalink
- Report Inappropriate Content
Hi Omar,
I put the extra square bracket only in the community (it was a mistake). Anyway, I started again from scratch following your question and it works.
Thank you very much for your help.
Best regards,
Gonzalo