Unlock a world of possibilities! Login now and discover the exclusive benefits awaiting you.
- Qlik Community
- :
- Forums
- :
- Analytics
- :
- New to Qlik Analytics
- :
- Re: Cumulative chart
- Subscribe to RSS Feed
- Mark Topic as New
- Mark Topic as Read
- Float this Topic for Current User
- Bookmark
- Subscribe
- Mute
- Printer Friendly Page
- Mark as New
- Bookmark
- Subscribe
- Mute
- Subscribe to RSS Feed
- Permalink
- Report Inappropriate Content
Cumulative chart
Hi Team
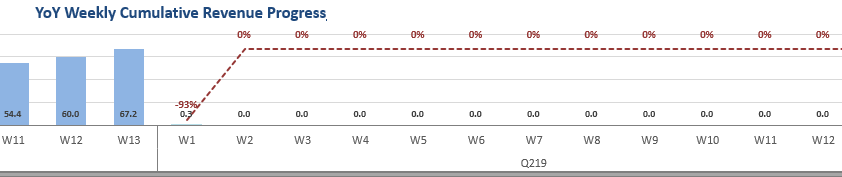
I would like to create dynamic cumulative chart which has revenue split per weeks. Right now, we are in week 1, from tomorrow, we will be in week 2, the cycle continues as this, every Tuesday new week enters (so it should be adding dynamically). I would like to show only those weeks which are active (however on x axis I still want to see weeks 1-13, just not displaying revenue which should not be there), right now it is showing me the same revenue from week 1 across all 13 weeks (i would like to neglect that revenue). I have variable telling me the current week number, but somehow it does not work.
Many thanks in advance
- Mark as New
- Bookmark
- Subscribe
- Mute
- Subscribe to RSS Feed
- Permalink
- Report Inappropriate Content
assuming your individual expression is Sum(LineSalesAmount)
use below
rangesum(above(Sum(LineSalesAmount),0,RowNo()))
- Mark as New
- Bookmark
- Subscribe
- Mute
- Subscribe to RSS Feed
- Permalink
- Report Inappropriate Content
Hi Dilip
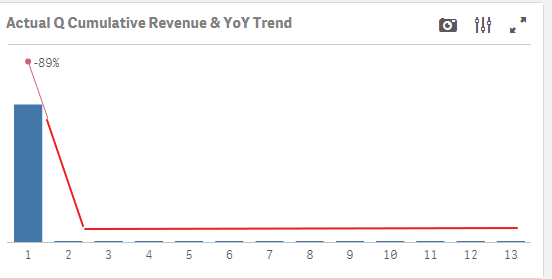
This is helping except all other weeks disappear. I am using currently this, because I also want it to be stable for current quarter.
RangeSum(Above(Sum({$<[qtr_flag]={0},qtr=>}revenue),0,RowNo()))
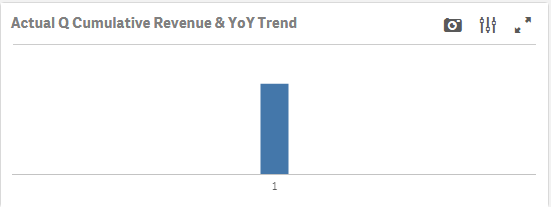
With your expression I am getting this.
rangesum(above(Sum(revenue),0,RowNo()))
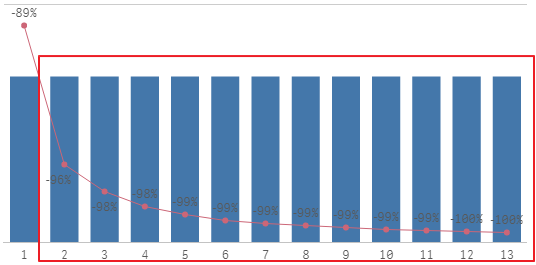
What I want to achieve is this (I have there also YoY trendline, so once I do not have new week, the trendline should be zero).
Excel example
Thanks!
- Mark as New
- Bookmark
- Subscribe
- Mute
- Subscribe to RSS Feed
- Permalink
- Report Inappropriate Content
Can you post your expression here?
Optionally (assuming from your name), we can move this discussion to Qlik komunita - CZ & SK and continue in Slovak/Czech language if that helps.
Juraj