Unlock a world of possibilities! Login now and discover the exclusive benefits awaiting you.
- Qlik Community
- :
- Forums
- :
- Analytics
- :
- New to Qlik Analytics
- :
- Re: Cumulative growth month on month in Bar Chart
- Subscribe to RSS Feed
- Mark Topic as New
- Mark Topic as Read
- Float this Topic for Current User
- Bookmark
- Subscribe
- Mute
- Printer Friendly Page
- Mark as New
- Bookmark
- Subscribe
- Mute
- Subscribe to RSS Feed
- Permalink
- Report Inappropriate Content
Cumulative growth month on month in Bar Chart
Hello Everyone!
I am looking to create a bar chart showing month on month growth rates. I would like to see cumulative growth month on month along with a trend line so that the period where sales went down could be easily extracted, for the respective product. Please let me know how I can achieve this?
Best Regards,
Rony
- Tags:
- qlik_sense_usability
- Mark as New
- Bookmark
- Subscribe
- Mute
- Subscribe to RSS Feed
- Permalink
- Report Inappropriate Content
Sunny,
The formula compares Jan 2017 against Jan 2016 and gives the right growth %. However, when I select months in the filter pane in order to see year to month growth rates, it does not come up properly. What I am looking for here is when I select Jan, Feb, March in the filter pane, the graph should show growth of Jan 16+Feb 16+Mar 16 over Jan 15+Feb 15+ Mar 15 and so on, similarly for the other years too. Also, as I want to see this part as a trend line. As such, in order to see this part of the graph, we will need to add another expression as another measure. Am I making sense? Please guide.
- Mark as New
- Bookmark
- Subscribe
- Mute
- Subscribe to RSS Feed
- Permalink
- Report Inappropriate Content
Probably help to share a sample.
- Mark as New
- Bookmark
- Subscribe
- Mute
- Subscribe to RSS Feed
- Permalink
- Report Inappropriate Content
Sunny,
As per the attached image, 2017 field, 2018 field and the % next to it is coming properly. Now, YTM 17 and YTM 18 is an accumulation of 2017 field and 2018 field. The percentages next to these accumulations are not showing up. This is the issue I am facing here. I do not have any other sample apart from this. All I can do is explain. Thanks for your help.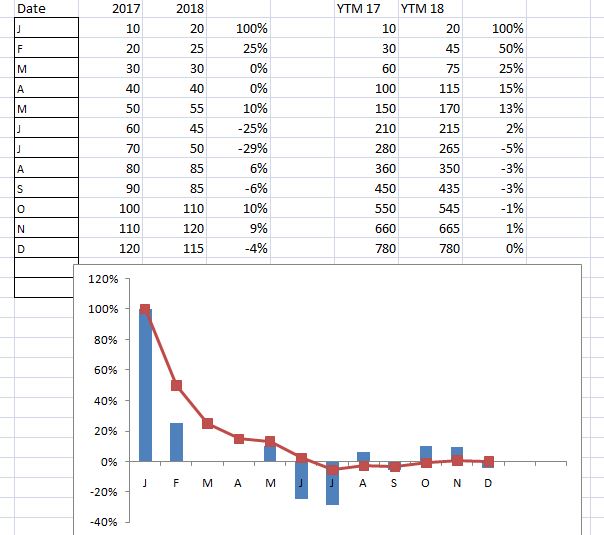
- Mark as New
- Bookmark
- Subscribe
- Mute
- Subscribe to RSS Feed
- Permalink
- Report Inappropriate Content
Don't you have an app where you are trying this?  or if this is in Excel how are you loading this data? what is the script? You will have to share more than this my friend.
- Mark as New
- Bookmark
- Subscribe
- Mute
- Subscribe to RSS Feed
- Permalink
- Report Inappropriate Content
Hi Sunny,
I understand what you are saying. Let me figure out a way and get back to you in this. Thanks for your help.
Regards,
ROny
- Mark as New
- Bookmark
- Subscribe
- Mute
- Subscribe to RSS Feed
- Permalink
- Report Inappropriate Content
Hi Sunny,
I am attaching a dummy excel and qvf file where I have been trying to achieve the cumulative growth rates. In sheet 2 of the excel file I have month wise data for 2017 and 2018. What I want to see is "Growth 18 vs 17" (Column H) as bars in the chart and "Cumulative Growth 18 vs 17" (Column L) as a trend line, in the same chart, as you can see in the excel file. In the attached qvf I have prepared a bar chart using the expression you sent me on Friday. Could you please check on this and let me know how I can achieve the desired result and also if there is any additional information you require.
Best Regards,
Rony
- Mark as New
- Bookmark
- Subscribe
- Mute
- Subscribe to RSS Feed
- Permalink
- Report Inappropriate Content
Here you are, try this
Sum({<[YearMonth.autoCalendar.Year] = {"$(=Year(Max([YearMonth.autoCalendar.Year])))"}>}Aggr(RangeSum(Above(Sum(Volume), 0, [YearMonth.autoCalendar.Month])), YearMonth))/
Sum({<[YearMonth.autoCalendar.Year] = {"$(=Year(Max([YearMonth.autoCalendar.Year]))-1)"}>}Aggr(RangeSum(Above(Sum(Volume), 0, [YearMonth.autoCalendar.Month])), YearMonth)) - 1

- Mark as New
- Bookmark
- Subscribe
- Mute
- Subscribe to RSS Feed
- Permalink
- Report Inappropriate Content
Hi Sunny,
Thank you for your response. I just checked the qvf you attached. The percentages are coming correctly when I select the years 2015 and 2016 in the year filter. However, it doesn't seem to be correct for 2017 over 2016. The % that show up for 2017 over 2016 is the same as when no year selections are made. Also, the first part of my question (trendline) where you gave the below formula is not showing up the right percentages.
RangeSum(Above(Sum(Measure), 0, Month))
/
Aggr(Above(RangeSum(Above(Sum(Measure), 0, Month)), 12), MonthYearField)
Could you let me know what is going wrong here? A YearMonth dimension in a continuous combo chart is what I am looking for.
Regards,
Rony
- Mark as New
- Bookmark
- Subscribe
- Mute
- Subscribe to RSS Feed
- Permalink
- Report Inappropriate Content
The percentages are the same because when nothing is selected, it is comparing 2017 to 2016. Is that not what you want? Also, what do you mean when you say first part of your question? What trendline?
- Mark as New
- Bookmark
- Subscribe
- Mute
- Subscribe to RSS Feed
- Permalink
- Report Inappropriate Content
Hi Sunny,
When nothing is selected, comparison between 2017 over 2016 is fine. However, this percentage (2017 over 2016) is not being calculated correctly, but 2016 over 2015 is being calculated correctly. By first part of my question I meant achieving "Growth 18 vs 17" (Column H)" in Sheet 2 of the attached excel sheet, for which you had given me the below expression as solution. However, this solution is not working right. This was to get individual month on month growth rates i.e, Jan-17 over Jan-16, Feb-17 over Feb-16 and so on. Please ignore the trend line part. I apologize if I am confusing you.
RangeSum(Above(Sum(Measure), 0, Month))/Aggr(Above(RangeSum(Above(Sum(Measure), 0, Month)), 12), MonthYearField)
Regards,
Rony