Unlock a world of possibilities! Login now and discover the exclusive benefits awaiting you.
- Qlik Community
- :
- Forums
- :
- Analytics
- :
- New to Qlik Analytics
- :
- Re: Cumulative growth month on month in Bar Chart
- Subscribe to RSS Feed
- Mark Topic as New
- Mark Topic as Read
- Float this Topic for Current User
- Bookmark
- Subscribe
- Mute
- Printer Friendly Page
- Mark as New
- Bookmark
- Subscribe
- Mute
- Subscribe to RSS Feed
- Permalink
- Report Inappropriate Content
Cumulative growth month on month in Bar Chart
Hello Everyone!
I am looking to create a bar chart showing month on month growth rates. I would like to see cumulative growth month on month along with a trend line so that the period where sales went down could be easily extracted, for the respective product. Please let me know how I can achieve this?
Best Regards,
Rony
- Tags:
- qlik_sense_usability
- Mark as New
- Bookmark
- Subscribe
- Mute
- Subscribe to RSS Feed
- Permalink
- Report Inappropriate Content
Ron my friend, are you trying to make a fool of me? The Excel file you attached earlier had two rows for each month in 2017 brother... and then you changed your data... how are things going to match if you change your data just in the Excel and not in the app... try reloading the app with the new data my friend and see if the number match or not
- Mark as New
- Bookmark
- Subscribe
- Mute
- Subscribe to RSS Feed
- Permalink
- Report Inappropriate Content
New expression
Sum({<[YearMonth.autoCalendar.Year] = {"$(=Year(Max([YearMonth.autoCalendar.Year])))"}>}Aggr(RangeSum(Above(Sum({<[YearMonth.autoCalendar.Year]>}Volume), 0, Only({1}[YearMonth.autoCalendar.Month]))), YearMonth))/
Sum({<[YearMonth.autoCalendar.Year] = {"$(=Year(Max([YearMonth.autoCalendar.Year]))-1)"}>}Aggr(RangeSum(Above(Sum({<[YearMonth.autoCalendar.Year]>}Volume), 0, Only({1}[YearMonth.autoCalendar.Month]))), YearMonth)) - 1
- Mark as New
- Bookmark
- Subscribe
- Mute
- Subscribe to RSS Feed
- Permalink
- Report Inappropriate Content
Hi Sunny,
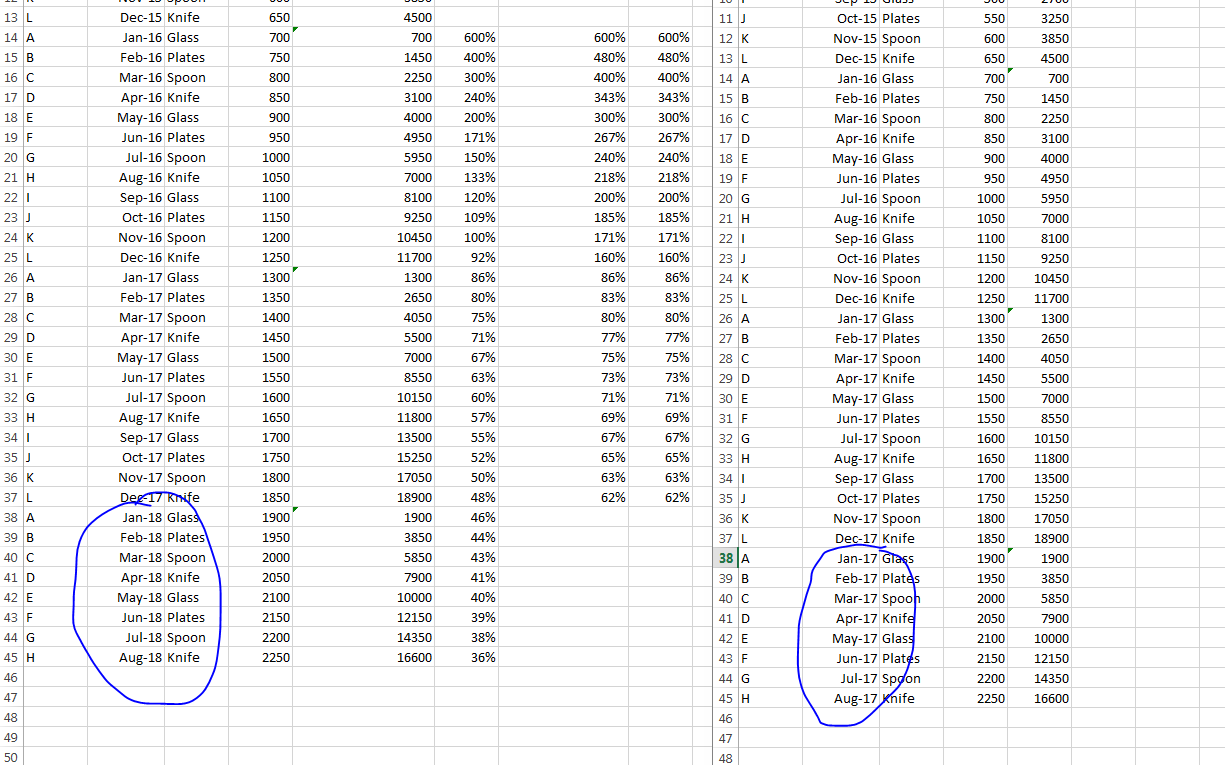
I apologize. It was an honest mistake. Let me attach a final qvf and excel with correct data. In sheet 2 of attached excel you will find "Growth 18 vs 17 (Column H)" and "Cumulative Growth 18 vs 17 (Column L)." Please help me achieve this in 2 charts respectively as I am still not able to get it right. Trying to fool you will be my loss. Thanks again.
Rony
- Mark as New
- Bookmark
- Subscribe
- Mute
- Subscribe to RSS Feed
- Permalink
- Report Inappropriate Content
Would you agree that you already have "Cumulative Growth 18 vs 17"? For "Growth 18 vs 17", try this expression
Sum({<[YearMonth.autoCalendar.Year] = {"$(=Year(Max([YearMonth.autoCalendar.Year])))"}>}Volume)/
Sum({<[YearMonth.autoCalendar.Year] = {"$(=Year(Max([YearMonth.autoCalendar.Year]))-1)"}>}Volume) - 1
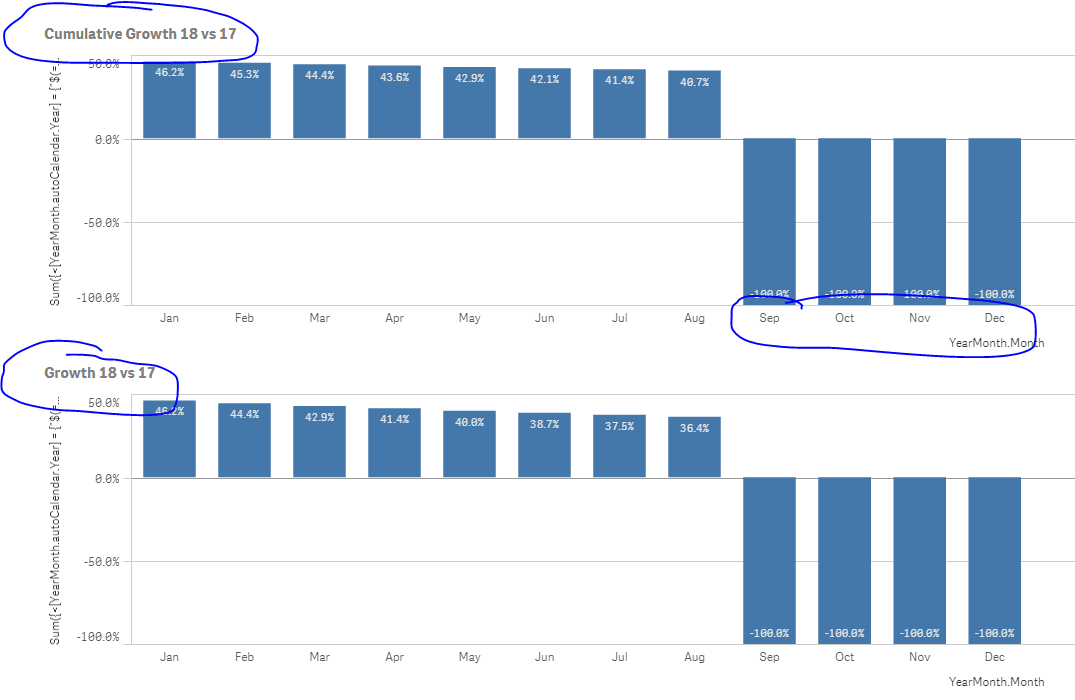
We see -100% for Sep, Oct, Nov, and Dec for obvious reasons that there is no data available for Sep, Oct, Nov, and Dec of 2018 which is why the percentage is -100%. If you can to get ride of this, you can add an if statement to remove it... If(Sum(Volume) <> 0, then do something, otherwise do nothing)
- Mark as New
- Bookmark
- Subscribe
- Mute
- Subscribe to RSS Feed
- Permalink
- Report Inappropriate Content
yes I agree. Let me try this and get back to you
- Mark as New
- Bookmark
- Subscribe
- Mute
- Subscribe to RSS Feed
- Permalink
- Report Inappropriate Content
Hi Sunny,
Thanks a lot for your help and for taking the time to resolve this issue . The expressions you sent me are working perfectly. There is one last question I have and that is, if I take "MonthYear" instead of "Month" as dimension, what kind of changes will have to be made to the expression, both cumulative and month on month.
Best Regards,
Rony
- Mark as New
- Bookmark
- Subscribe
- Mute
- Subscribe to RSS Feed
- Permalink
- Report Inappropriate Content
So, let me ask you this.... if you have MonthYear... would you still want to see 1 year on the chart?
- Mark as New
- Bookmark
- Subscribe
- Mute
- Subscribe to RSS Feed
- Permalink
- Report Inappropriate Content
Hi Sunny,
I want to see all the years continuously. As of now I have data from Jan-2014 to July-2018.
Rony
- Mark as New
- Bookmark
- Subscribe
- Mute
- Subscribe to RSS Feed
- Permalink
- Report Inappropriate Content
Cumulative Growth or just month on month growth?
- Mark as New
- Bookmark
- Subscribe
- Mute
- Subscribe to RSS Feed
- Permalink
- Report Inappropriate Content
I would like to see both Sunny.
Regards,
Rony