Unlock a world of possibilities! Login now and discover the exclusive benefits awaiting you.
- Qlik Community
- :
- Forums
- :
- Analytics
- :
- New to Qlik Analytics
- :
- Custom Colors
- Subscribe to RSS Feed
- Mark Topic as New
- Mark Topic as Read
- Float this Topic for Current User
- Bookmark
- Subscribe
- Mute
- Printer Friendly Page
- Mark as New
- Bookmark
- Subscribe
- Mute
- Subscribe to RSS Feed
- Permalink
- Report Inappropriate Content
Custom Colors
HI all,
jgd
I am using below Measures and dimensions. I am finding difficulty in writing expression for custom color please help on it,
Dimension:
1. If(Match(client_id, '15','12','13','19','6'),client_id)
2. Week_group
Measure:
count({<weekstart={">=$(=date(max(weekstart)-35))<$(=date(max(weekstart)-7))"},DateType={'invitation'},
client_id = {'15','12','13','19','6'}>}invitation_id)
I need a custom color for bars which representing the counts of last 4 weeks for the client_id's.
Regards,
Kumar
- Tags:
- custom color
- « Previous Replies
-
- 1
- 2
- Next Replies »
- Mark as New
- Bookmark
- Subscribe
- Mute
- Subscribe to RSS Feed
- Permalink
- Report Inappropriate Content
Why don't you just use client_id as the dimension, and the expression:
count({<weekstart={">=$(=date(max(weekstart)-35))<$(=date(max(weekstart)-7))"},DateType={'invitation'}>}invitation_id)
>>need a custom color for bars which representing the counts of last 4 weeks for the client_id's.
The same colour for all clients? You only have 4 weeks on the chart.
- Mark as New
- Bookmark
- Subscribe
- Mute
- Subscribe to RSS Feed
- Permalink
- Report Inappropriate Content
I need only 5 client_id's, so i am using Valuelist.
Same colour for all clients, But the bar colors should be : Light Gray, Dark Gray, Light Blue & Dark Blue.
- Mark as New
- Bookmark
- Subscribe
- Mute
- Subscribe to RSS Feed
- Permalink
- Report Inappropriate Content
>>I need only 5 client_id's, so i am using Valuelist.
That's not a good reason. Rather use a calculated dimension based on client id, like
=If(Match(client_id ,'15','12','13','19','6'), client_id)
or use a set filter in the expression:
=count({<weekstart={">=$(=date(max(weekstart)-35))<$(=date(max(weekstart)-7))"},DateType={'invitation'}, client_id = {'15','12','13','19','6'}>}invitation_id)
>>Same colour for all clients, But the bar colors should be : Light Gray, Dark Gray, Light Blue & Dark Blue
Same colour, but not the same?
- Mark as New
- Bookmark
- Subscribe
- Mute
- Subscribe to RSS Feed
- Permalink
- Report Inappropriate Content
- Mark as New
- Bookmark
- Subscribe
- Mute
- Subscribe to RSS Feed
- Permalink
- Report Inappropriate Content
And you from me!?
- Mark as New
- Bookmark
- Subscribe
- Mute
- Subscribe to RSS Feed
- Permalink
- Report Inappropriate Content
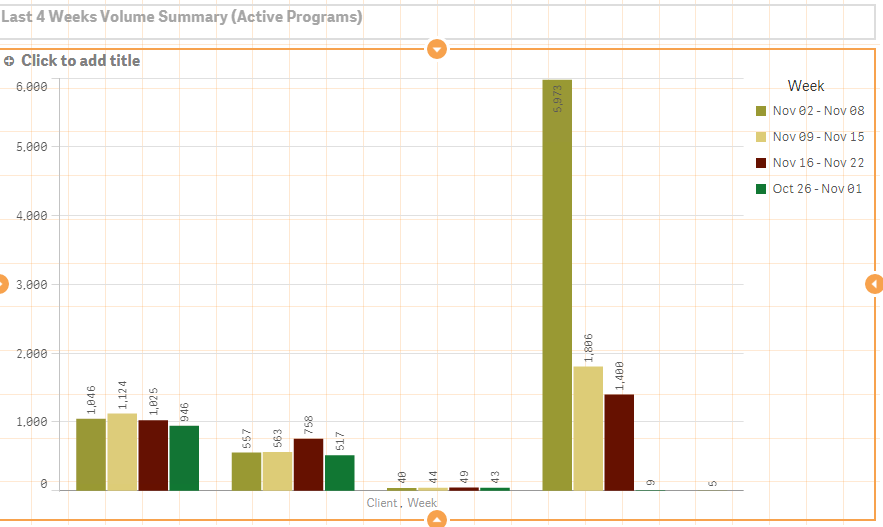
In above attached picture you can see 5 clusters, each cluster has 4 bars, some cluster has only one and three because they are zero values.
Now I need bar colors like below
1 Light Gray,
2 Dark Gray,
3 Light Blue &
4 Dark Blue.
- Mark as New
- Bookmark
- Subscribe
- Mute
- Subscribe to RSS Feed
- Permalink
- Report Inappropriate Content
Hi Promodgc3,
Try doing this:
I have attached a sample qvf for colouring measures.
- Mark as New
- Bookmark
- Subscribe
- Mute
- Subscribe to RSS Feed
- Permalink
- Report Inappropriate Content
I have added two dimensions for bar chart, in X-axis it is displaying both client and week labels,
Is their any way to display only client and exclude week labels, as week labels is showing in legend, it's not necessary.
- Mark as New
- Bookmark
- Subscribe
- Mute
- Subscribe to RSS Feed
- Permalink
- Report Inappropriate Content
Hi Pramod,
I am afraid that you cannot restrict only one dimension label. Hiding both is possible but not 1.
- « Previous Replies
-
- 1
- 2
- Next Replies »