Unlock a world of possibilities! Login now and discover the exclusive benefits awaiting you.
- Qlik Community
- :
- Forums
- :
- Analytics
- :
- New to Qlik Analytics
- :
- Re: Custom reference lines by end user is possible...
- Subscribe to RSS Feed
- Mark Topic as New
- Mark Topic as Read
- Float this Topic for Current User
- Bookmark
- Subscribe
- Mute
- Printer Friendly Page
- Mark as New
- Bookmark
- Subscribe
- Mute
- Subscribe to RSS Feed
- Permalink
- Report Inappropriate Content
Custom reference lines by end user is possible?
Hi all,
Lets say I have a simple Line chart with time frame on X-axis and Total Sales on Y-Axis. One of my clients wants the ability to be add reference lines based in the line chart based on when event outage happened.
Is this possible in Qliksense please? Any inputs would be appreciated
- Mark as New
- Bookmark
- Subscribe
- Mute
- Subscribe to RSS Feed
- Permalink
- Report Inappropriate Content
Hi @siri_v ,
Yes, you can add reference line on the chart base on user input.
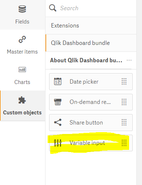
for that you need to drag a variable input component from a custom object and store the value in a variable. get from the input component., and use the same variable in the reference line
Abhijit
keep Qliking...
Help users find answers! Don't forget to mark a solution that worked for you!
- Mark as New
- Bookmark
- Subscribe
- Mute
- Subscribe to RSS Feed
- Permalink
- Report Inappropriate Content
Please follow the below steps to achieve the requirement.
1. drag Variable Input componant from Qlik dashboard Bundle.
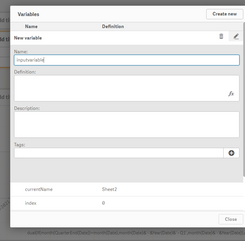
2. Create a New Variable as inputvariable
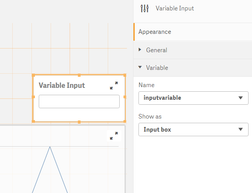
3. Use the same created variable in variable input
4. In Line chart Addon set created variable
results as below.
Abhijit
keep Qliking...
Help users find answers! Don't forget to mark a solution that worked for you!
- Mark as New
- Bookmark
- Subscribe
- Mute
- Subscribe to RSS Feed
- Permalink
- Report Inappropriate Content
Thank you for your response @abhijitnalekar
Unfortunately this does not answer my question.. Let me make it more clear.. Let's say I have the below line chart. The client wants to have the ability to draw vertical lines. For example.. Red verticle line on Jan and label as "Failure1" . Orange verticle line in May ad label as"Profit1".
He needs more like annotations.. I even tried annotations but I was not very clear about it..
Client wants to add add verticle reference lines and label it with some event name with respect to the X axis.
If this can be solved by the variable input method, Can you explain how it can be added as verticle line please..
Thanks a ton
- Mark as New
- Bookmark
- Subscribe
- Mute
- Subscribe to RSS Feed
- Permalink
- Report Inappropriate Content
HI @siri_v ,
It looks not feasible as per my knowledge to adding a verticle reference Line.
But as you have described the requirement I can suggest a workaround for the same.
As the client wants to highlight the month on the basis of some threshold, we can handle it by using variable input and color the trend line as per the value.
Eg. as Jan is a Failure we can color the Jan month in red and May in Green some thing like this.
Abhijit
keep Qliking...
Help users find answers! Don't forget to mark a solution that worked for you!


