Unlock a world of possibilities! Login now and discover the exclusive benefits awaiting you.
- Qlik Community
- :
- Forums
- :
- Analytics
- :
- New to Qlik Analytics
- :
- Date und Time
- Subscribe to RSS Feed
- Mark Topic as New
- Mark Topic as Read
- Float this Topic for Current User
- Bookmark
- Subscribe
- Mute
- Printer Friendly Page
- Mark as New
- Bookmark
- Subscribe
- Mute
- Subscribe to RSS Feed
- Permalink
- Report Inappropriate Content
Date und Time
Hallo Zusammen,
ich habe eine Excel Tabelle bei der ich zwei Spalten mit Date und Time habe
Date: Time:
| 23.11.2016 | 22:56:34 |
| 23.11.2016 | 16:56:29 |
| 23.11.2016 | 04:59:27 |
| 22.11.2016 | 22:59:20 |
| 22.11.2016 | 16:59:15 |
| 22.11.2016 | 10:59:09 |
| 22.11.2016 | 04:59:04 |
| 21.11.2016 | 22:58:58 |
| 21.11.2016 | 16:58:53 |
| 21.11.2016 | 10:58:48 |
| 21.11.2016 | 04:58:37 |
Ich möchte jetzt im Datenmanager die zwei Spalten in eine Integrieren, so dass ich bei einem Balkendiagramm die Dimension Date+Time stehen habe (23.11.2016 22:56:34 usw.)
Nachdem ich die Daten Integriert habe wird jedoch eine Zahl ausgegeben wie 426970,9555949... usw.
Wie kann ich das ganze realisieren
- « Previous Replies
-
- 1
- 2
- Next Replies »
- Mark as New
- Bookmark
- Subscribe
- Mute
- Subscribe to RSS Feed
- Permalink
- Report Inappropriate Content
where it is? in your data?
- Mark as New
- Bookmark
- Subscribe
- Mute
- Subscribe to RSS Feed
- Permalink
- Report Inappropriate Content
check with data if anything is in wrong format
- Mark as New
- Bookmark
- Subscribe
- Mute
- Subscribe to RSS Feed
- Permalink
- Report Inappropriate Content
TRY below
LOAD *,
DATE(DATE(Date,'dd.mm.yyyy')&TIME(Time,'h:mm:ss'),'DD.MM.YYYY h:mm:ss') as DateTime INLINE [
Date,Time
23.11.2016,22:56:34
23.11.2016,16:56:29
23.11.2016,04:59:27
22.11.2016,22:59:20
22.11.2016,16:59:15
22.11.2016,10:59:09
22.11.2016,04:59:04
21.11.2016,22:58:58
21.11.2016,16:58:53
21.11.2016,10:58:48
21.11.2016,04:58:37]
If a post helps to resolve your issue, please accept it as a Solution.
- Mark as New
- Bookmark
- Subscribe
- Mute
- Subscribe to RSS Feed
- Permalink
- Report Inappropriate Content
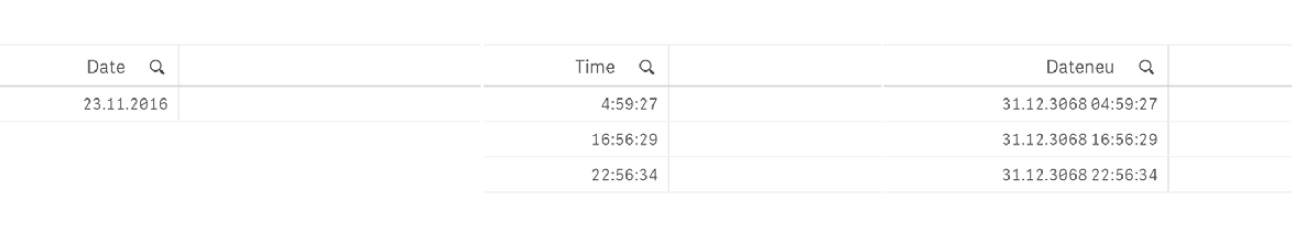
Data is correct but the results are incorrect. It´s look like this
- Mark as New
- Bookmark
- Subscribe
- Mute
- Subscribe to RSS Feed
- Permalink
- Report Inappropriate Content
what is the script you have used?
- Mark as New
- Bookmark
- Subscribe
- Mute
- Subscribe to RSS Feed
- Permalink
- Report Inappropriate Content
Timestamp([Date]&[Time], 'DD.MM.YYYY hh:mm:ss') AS [Dateneu]
- Mark as New
- Bookmark
- Subscribe
- Mute
- Subscribe to RSS Feed
- Permalink
- Report Inappropriate Content
PFA
- « Previous Replies
-
- 1
- 2
- Next Replies »