Unlock a world of possibilities! Login now and discover the exclusive benefits awaiting you.
- Qlik Community
- :
- Forums
- :
- Analytics
- :
- New to Qlik Analytics
- :
- Dates on Charts
- Subscribe to RSS Feed
- Mark Topic as New
- Mark Topic as Read
- Float this Topic for Current User
- Bookmark
- Subscribe
- Mute
- Printer Friendly Page
- Mark as New
- Bookmark
- Subscribe
- Mute
- Subscribe to RSS Feed
- Permalink
- Report Inappropriate Content
Dates on Charts
Hi All,
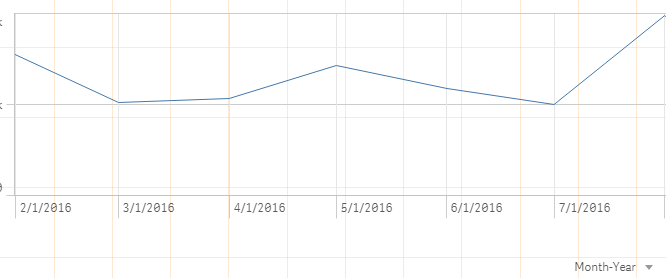
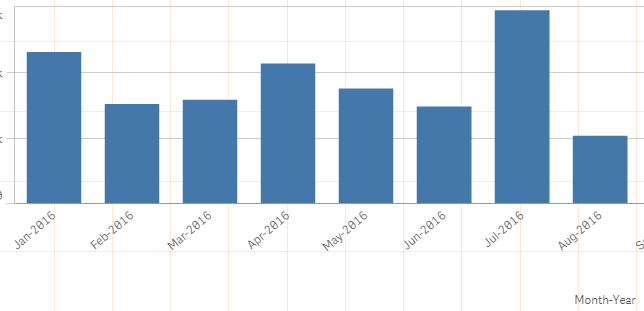
I'm noticing that if I select a line chart in Sense, the Month-Year measure is showing up differently than on a bar chart. Below are two pictures of the same data. All I did was convert from line to bar chart. What is causing the difference in the Month-Year dimension? I even tried doing a formula in the expression date([Month-Year],'MMM-YYYY').
Accepted Solutions
- Mark as New
- Bookmark
- Subscribe
- Mute
- Subscribe to RSS Feed
- Permalink
- Report Inappropriate Content
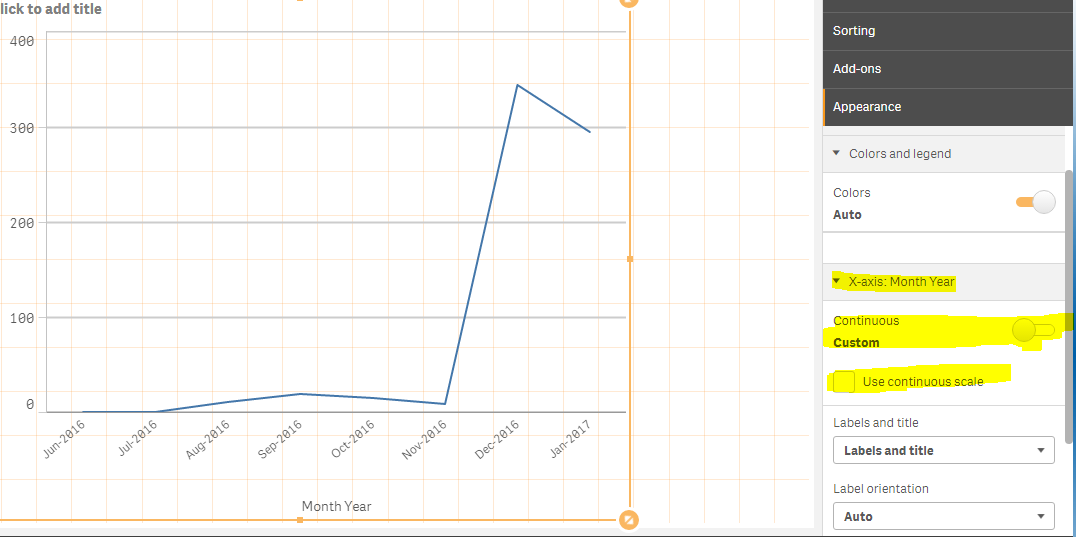
For Line Chart, change the X-axis dimension to 'Custom' and uncheck the 'Use continuous scale' and you'll see same Month-Year format for both charts.
- Mark as New
- Bookmark
- Subscribe
- Mute
- Subscribe to RSS Feed
- Permalink
- Report Inappropriate Content
Can you post your sample data you are using.
- Mark as New
- Bookmark
- Subscribe
- Mute
- Subscribe to RSS Feed
- Permalink
- Report Inappropriate Content
For Line Chart, change the X-axis dimension to 'Custom' and uncheck the 'Use continuous scale' and you'll see same Month-Year format for both charts.
- Mark as New
- Bookmark
- Subscribe
- Mute
- Subscribe to RSS Feed
- Permalink
- Report Inappropriate Content
That did it. Thanks!