Unlock a world of possibilities! Login now and discover the exclusive benefits awaiting you.
- Qlik Community
- :
- Forums
- :
- Analytics
- :
- New to Qlik Analytics
- :
- Day + Frac Time Manipulation
- Subscribe to RSS Feed
- Mark Topic as New
- Mark Topic as Read
- Float this Topic for Current User
- Bookmark
- Subscribe
- Mute
- Printer Friendly Page
- Mark as New
- Bookmark
- Subscribe
- Mute
- Subscribe to RSS Feed
- Permalink
- Report Inappropriate Content
Day + Frac Time Manipulation
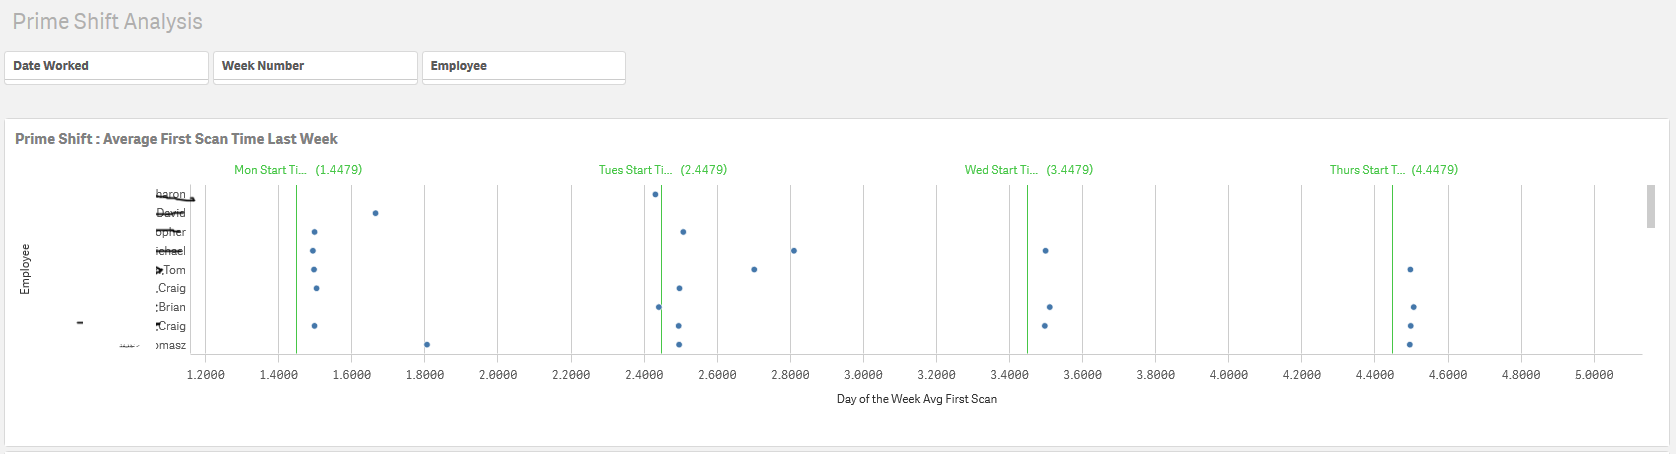
I am new to QS...I have a distribution chart see image that has Employees on the y and Days of the week on the x (For the pervious week). The data point is the Average Min ScanTime for each day. . There are reference lines for each day of the week 1.4479 Monday (1) 0.4479 is the frac(07:30:00) start time ie when the shift starts. The start time is the same for each day of the week. The purpose is to show which employees are on average furthest away from the shift start time in a first activity of a scan. I have had to generate the data as
SActionDateTime is a recording of a scan ( on a barcode scanner)e.g.
'01/05/2020 07:35:00'
'01/05/2020 07:37:00'
'01/05/2020 07:38:00'
WeekDay(SActionDateTime) + Time(Frac(SActionDateTime), 'hh:mm:ss')) as wrk_Time;
However from an end user perspective I would like to show
* The actual scan time on the chart not the fractions
* The Name of the weekday Mon not 1
* Only show the top 10 people with the highest average min scantime away from the shift time
Distribution Chart
Point = Minwrk_Time
Y axis = Employee
X-Axis = Avg({<Date_Worked_Year={'$(=Max(Date_Worked_Year))'},SLT_Week={'$(=Max(SLT_Week)-1)'},Shift_Type={'Late'},Shift_Type={'Late'}>}Minwrk_Time)
Map_Minwrk_Time:
Mapping Load
SDate &'|'& EMPLOYEE_NUMBER As MT_Key,
Min(wrk_Time) As Minwrk_Time
Resident workdata_01
Group By
SDate &'|'& EMPLOYEE_NUMBER;
Accepted Solutions
- Mark as New
- Bookmark
- Subscribe
- Mute
- Subscribe to RSS Feed
- Permalink
- Report Inappropriate Content
@ArnadoSandoval Thanks I have implemented those changes and they are working well
- Mark as New
- Bookmark
- Subscribe
- Mute
- Subscribe to RSS Feed
- Permalink
- Report Inappropriate Content
Hi @andymayo
Your application is looking good 👍 now addressing your first two questions, you need to use the function Dual; this function allows us to represent fields with dual representation, text which is the value to use on displays and numeric which is used in Qlik's internal calculations; with this function we only needed to apply a couple of changes:
Script Changes (with the ApplyMap for the Minwrk_Time):
Map_Minwrk_Time:
Mapping Load
    Date &'|'& Employee  As MT_Key,
    Min(wrk_Time)        As Minwrk_Time
Resident workdata_01
Group By
    Date &'|'& Employee;

NoConcatenate

workdata_02:
Load Distinct *,
    Dual(Day & ' ' & Time, ApplyMap('Map_Minwrk_Time', Date &'|'& Employee)) As Minwrk_Time
//     ApplyMap('Map_Minwrk_Time', Date &'|'& Employee) As Minwrk_Time
Resident workdata_01;
Left Join
IntervalMatch (wrk_Time) Load "wrk_ST" As ST, "wrk_ET" As ET Resident Shifts;
I commented out the old ApplyMap on the Map_Minwrk_Time mapping table replacing it with a new one implementing a Dual function, the function assign the text value of the Minwrk_Time as Day & ' ' & Time
That's the only change required on the script.
Front-End (User Interface):
With the Measures X-Axis change its number formatting to Custom, with a Format pattern as hh:mm (see screenshot)

For the reference lines no changes were required, the X-Axis custom formatting also included the reference lines.

The scatter graph now looks like this:

The Top 10 employees:
I did not try it because my mocked up version only have 3 employees, my sample is too small, I will add enough records to implement the top ten employees, still these enhancements should help you !!! (Actually, they were two small changes)
Hope this helps,
A journey of a thousand miles begins with a single step.
- Mark as New
- Bookmark
- Subscribe
- Mute
- Subscribe to RSS Feed
- Permalink
- Report Inappropriate Content
@ArnadoSandoval Thanks I have implemented those changes and they are working well