Unlock a world of possibilities! Login now and discover the exclusive benefits awaiting you.
- Qlik Community
- :
- Forums
- :
- Analytics
- :
- New to Qlik Analytics
- :
- Re: Dimesnion % Calculation
Options
- Subscribe to RSS Feed
- Mark Topic as New
- Mark Topic as Read
- Float this Topic for Current User
- Bookmark
- Subscribe
- Mute
- Printer Friendly Page
Turn on suggestions
Auto-suggest helps you quickly narrow down your search results by suggesting possible matches as you type.
Showing results for
Creator
2018-12-20
10:32 AM
- Mark as New
- Bookmark
- Subscribe
- Mute
- Subscribe to RSS Feed
- Permalink
- Report Inappropriate Content
Dimesnion % Calculation
Dear Experts,
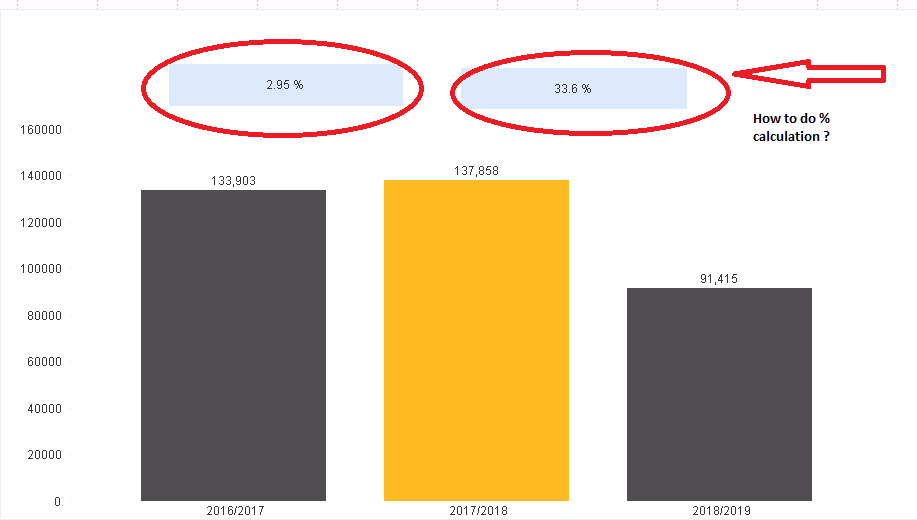
I need your help. Actually I need to calculate the percentage between the dimension columns. Please review the attached picture. The top 2 percentage calculations marked with red sign are my desired results. Can anyone please tell me how to do these calculation in chart or on a text box ?
Thanks in advance
Regards
Waqas Shah
1,717 Views
- « Previous Replies
-
- 1
- 2
- Next Replies »
11 Replies
MVP
2018-12-20
12:16 PM
- Mark as New
- Bookmark
- Subscribe
- Mute
- Subscribe to RSS Feed
- Permalink
- Report Inappropriate Content
Check attached...
Script changes
ActivitySales:
LOAD *,
	 SubField(ActivityFinancialYear, '/', 2) as Year;
LOAD * INLINE [
    SalesItem, ActivityPrice, ActivityDate, ActivityMonth, ActivityFinancialYear
    1, 100, 01-01-2015, January, 2015/2016
    2, 200, 20-01-2015, January, 2015/2016
    1, 150, 15-02-2015, February, 2015/2016
    2, 210, 22-02-2015, February, 2015/2016
    1, 250, 01-03-2015, March, 2015/2016
    2, 270, 10-03-2015, March, 2015/2016
    2, 300, 19-04-2016, April, 2016/2017
    2, 600, 13-04-2016, April, 2016/2017
    2, 970, 25-05-2016, May, 2016/2017
    2, 120, 28-05-2016, May, 2016/2017
    2, 330, 03-06-2016, June, 2016/2017
    2, 650, 06-06-2016, June, 2016/2017
    2, 170, 07-07-2017, July, 2017/2018
    2, 960, 09-07-2017, July, 2017/2018
    2, 150, 10-08-2017, August, 2017/2018
    2, 235, 11-08-2017, August, 2017/2018
    2, 344, 14-09-2017, September, 2017/2018
    2, 496, 15-09-2017, September, 2017/2018
    2, 483, 06-10-2018, October, 2018/2019
    2, 798, 27-10-2018, October, 2018/2019
    2, 101, 23-11-2018, November, 2018/2019
    2, 502, 30-11-2018, November, 2018/2019
    2, 659, 19-12-2018, December, 2018/2019
    2, 710, 03-12-2018, December, 2018/2019
];
Expression
=Num(Sum({<Year = {"$(=Max(Year))"}>} ActivityPrice)/Sum({<Year = {"$(=Max(Year)-1)"}>} ActivityPrice)-1, '##.#%')
1,759 Views
Creator
2018-12-20
12:21 PM
Author
- Mark as New
- Bookmark
- Subscribe
- Mute
- Subscribe to RSS Feed
- Permalink
- Report Inappropriate Content
Many Thanks you are a star..![]()
![]()
344 Views
- « Previous Replies
-
- 1
- 2
- Next Replies »
Community Browser