Unlock a world of possibilities! Login now and discover the exclusive benefits awaiting you.
- Qlik Community
- :
- Forums
- :
- Analytics
- :
- New to Qlik Analytics
- :
- Re: Disabling of filter for a a chart in qliksense
- Subscribe to RSS Feed
- Mark Topic as New
- Mark Topic as Read
- Float this Topic for Current User
- Bookmark
- Subscribe
- Mute
- Printer Friendly Page
- Mark as New
- Bookmark
- Subscribe
- Mute
- Subscribe to RSS Feed
- Permalink
- Report Inappropriate Content
Disabling of filter for a a chart in qliksense
Hello,
I am trying to disable a filter in Qliksense.
I know in qlikview it is easy, we can just right click and detach the respective chart.
Is there is something similar in Qliksense, as I am not able to find it.
Also, I have 4 filters in my qliksense app, is there is a possibility that I can use only 3 of them for one chart and all 4 for the remaining items in the app?
Thank you for you help.
Best Regards,
Vipin Saroha
Accepted Solutions
- Mark as New
- Bookmark
- Subscribe
- Mute
- Subscribe to RSS Feed
- Permalink
- Report Inappropriate Content
Hi Vipin,
If you want to ignore a filter in Qlik Sense then you could try using set analysis in your expression.
As an example, if you want to ignore selections for the dimension called Year in a sum function for a measure called quantity then the function would be Sum({$<Year=>}Quantity).
Hope this helps.
Rod
- Mark as New
- Bookmark
- Subscribe
- Mute
- Subscribe to RSS Feed
- Permalink
- Report Inappropriate Content
Hello Vipin,
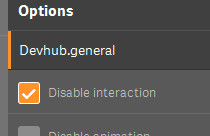
Rod's suggestion is the correct one - as there isn't a disable interactive capability yet for the chart object. I have requested this feature for the out of the box charts - because it DOES exist in Qlik Sense Developer hub:

But that is for taking your Qlik Sense content out of the default environment and using it in web applications and mash-ups etc.
If you are new to Set Analysis - you can see examples of this here: A Beginners' Introduction to Set Analysis (video)
Please mark the appropriate replies as CORRECT / HELPFUL so our team and other members know that your question(s) has been answered to your satisfaction.
Regards,
Mike Tarallo
Qlik
Mike Tarallo
Qlik
- Mark as New
- Bookmark
- Subscribe
- Mute
- Subscribe to RSS Feed
- Permalink
- Report Inappropriate Content
Thank you Rod for this, your suggestion helped me with what I needed.
- Mark as New
- Bookmark
- Subscribe
- Mute
- Subscribe to RSS Feed
- Permalink
- Report Inappropriate Content
this suggestion will not help for disabling dimensions.
- Mark as New
- Bookmark
- Subscribe
- Mute
- Subscribe to RSS Feed
- Permalink
- Report Inappropriate Content
I tried this and it did not work. I have a table that uses a set expression to PIn the Measure results to 2021 which works fine. The chart has in it a dimension (CondDesc) that will give me a count of insurance claimants based on the current period i.e. 2021 which looks like {$<RptSetName={'2021-CY'}>} Claimants. For the next measure I want to create a % of the total Claimants. So to see if removing the filter works I did this as the measure T-Claimants as {$<RptSetName={'2021-CY'}, CondDesc={}>} Claimants. I was expecting something like this...
CondDesc Claimants T-Claimants
HBP 58 540
CHF 12 540
But Instead Get This...
CondDesc Claimants T-Claimants
HBP 58 58
CHF 12 12
NOTE: The Grid Total does show the correct number of 540
- Mark as New
- Bookmark
- Subscribe
- Mute
- Subscribe to RSS Feed
- Permalink
- Report Inappropriate Content
What if we have multiple dimension for example we have Year and Region
which will work
Sum({$<Year, Region>}Quantity).
or
sum(${<Year>} ${<Region>} Quantity)