Unlock a world of possibilities! Login now and discover the exclusive benefits awaiting you.
- Qlik Community
- :
- Forums
- :
- Analytics
- :
- New to Qlik Analytics
- :
- Re: Display Value and Percentage in Pie Chart
- Subscribe to RSS Feed
- Mark Topic as New
- Mark Topic as Read
- Float this Topic for Current User
- Bookmark
- Subscribe
- Mute
- Printer Friendly Page
- Mark as New
- Bookmark
- Subscribe
- Mute
- Subscribe to RSS Feed
- Permalink
- Report Inappropriate Content
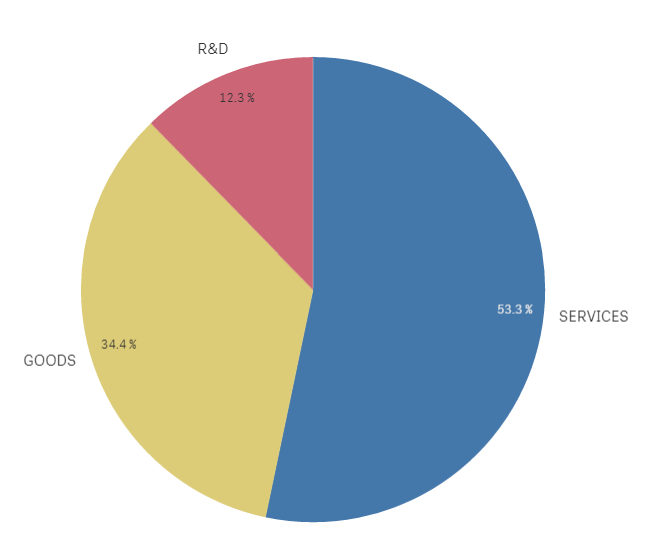
Display Value and Percentage in Pie Chart
Qlik Sense provides the option of displaying a value or percentage in a pie chart. How do I display both?
Presentation:
Value labels: Custom->Values
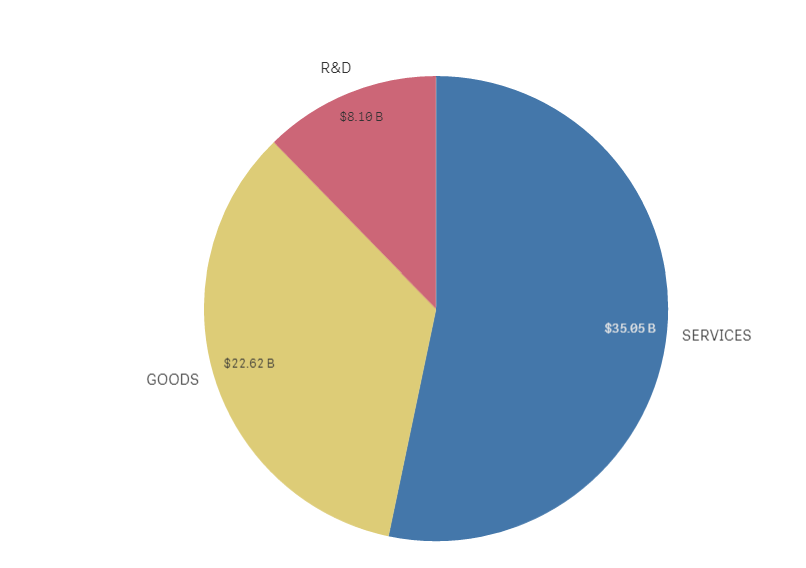
Value labels: Auto->Percentage
Thanks for your help.
- Tags:
- pie chart %
- « Previous Replies
-
- 1
- 2
- Next Replies »
- Mark as New
- Bookmark
- Subscribe
- Mute
- Subscribe to RSS Feed
- Permalink
- Report Inappropriate Content
Hey Omar,
I tried exactly how you have suggested, but its not showing me the value and percentage simultaneously in the pie chart, it is also not throwing any error.
What could be wrong? Please advise.
PS - when I select "values" under presentation, it shows only value the %tage is not showing up.
Regards,
Mudaser
- Mark as New
- Bookmark
- Subscribe
- Mute
- Subscribe to RSS Feed
- Permalink
- Report Inappropriate Content
Hello,
You can also vote for this idea :
https://community.qlik.com/t5/Qlik-Sense-Enterprise-Ideas/Display-natively-Value-and-Percentage-in-P...
- Mark as New
- Bookmark
- Subscribe
- Mute
- Subscribe to RSS Feed
- Permalink
- Report Inappropriate Content
Anyone can help, can't seem to work it. It doesn't show any error nor it's showing proper way.
My dimension is a variable.
so my formula looks like: =$(vVar)&' : '&aggr(num(count(ID)/count(total <$(vVar)> count(ID)),'#,##0.00%'),$(vVar))
I would appreciate very much.
All I can see in the chart is =$(vVar)&' : '.... part. After ' : ' empty
- Mark as New
- Bookmark
- Subscribe
- Mute
- Subscribe to RSS Feed
- Permalink
- Report Inappropriate Content
Can this function be expanded across a second dimension? I've tried like below, but it doesn't work. The per second dimension just presents the overall value of the first dimension ...
=[G-R&D-S] & [myextradim] & ':' & AGGR(NUM(Sum([Action Obligation])/Sum(TOTAL<[G-R&D-S]> Action Obligation]),'#,##0.00%'), [G-R&D-S],[myextradim])
- Mark as New
- Bookmark
- Subscribe
- Mute
- Subscribe to RSS Feed
- Permalink
- Report Inappropriate Content

Hello! I'm trying to get both value and percentage, but i cannot get the formula to work.
Could someone help me out?
=[DebiteurRegion]&' : '& aggr(num(sum([sum({1<VerkoopstatistiekLastFull12MonthsFlag = {1}>}VerkoopstatistiekOmzetBedrag)])/sum(total<[DebiteurRegion]>
[sum({1<VerkoopstatistiekLastFull12MonthsFlag = {1}>}VerkoopstatistiekOmzetBedrag)]),'#,##0.00%'),[DebiteurRegion])
Dimensions: DebiteurRegion
Measure: sum({1<VerkoopstatistiekLastFull12MonthsFlag = {1}>}VerkoopstatistiekOmzetBedrag)
Thanks in advance.
Sandra
- Mark as New
- Bookmark
- Subscribe
- Mute
- Subscribe to RSS Feed
- Permalink
- Report Inappropriate Content
Hi Omar,
Your suggestion works like a charm. But I see a drawback to this. Its adding the % to the Legend as well. Is there a way to prevent this?
- Mark as New
- Bookmark
- Subscribe
- Mute
- Subscribe to RSS Feed
- Permalink
- Report Inappropriate Content
Hi,
what am I doing wrong?
Unfortunately, I don't get any values behind the dimension.
'VST_Call.xCallart'&' : '& aggr(num(Count({<VST_Call.xCallart = {10}>}distinct [VST_Call.Callnumber])/Count({<VST_Call.xCallart = {10,11,12}>} distinct [VST_Call.Callnumber])),'#,##0.00%')
Can you help me, please?
- « Previous Replies
-
- 1
- 2
- Next Replies »