Unlock a world of possibilities! Login now and discover the exclusive benefits awaiting you.
- Qlik Community
- :
- Forums
- :
- Analytics
- :
- New to Qlik Analytics
- :
- Re: Display any text on the bar chart in Qlik Sens...
- Subscribe to RSS Feed
- Mark Topic as New
- Mark Topic as Read
- Float this Topic for Current User
- Bookmark
- Subscribe
- Mute
- Printer Friendly Page
- Mark as New
- Bookmark
- Subscribe
- Mute
- Subscribe to RSS Feed
- Permalink
- Report Inappropriate Content
Display any text on the bar chart in Qlik Sense
Hi Guys,
I believe it should be a pretty simple one but how can I display any text on the bars itself in bar chart in Qlik Sense?
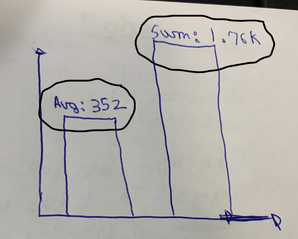
For instance, I'm calculating the sum and average for some sample data

Is it possible to display text along with the total number as highlighted in the paper? OR Any workaround? (It's okay to display it inside the bars)
My data is:
load * Inline [
Dim, Value
1, 1000
2, 500,
3, 200
4, 50
5, 10
];
My measures are-
For Average: Avg({<Dim=>}Value)
For Sum: Sum({<Dim=>}Value)
I tried using the Dual function but it didn't display 'Avg' or 'Sum'
Thank you
- Tags:
- bar chart
- Subscribe by Topic:
-
barsplus
-
dual
-
dual data type
-
Qlik Sense
-
QLIKVIEW Chart
-
Set Analysis
-
Text on charts
Accepted Solutions
- Mark as New
- Bookmark
- Subscribe
- Mute
- Subscribe to RSS Feed
- Permalink
- Report Inappropriate Content
1- Use expression with dual. Dual('Sum: '&Sum(Value),Sum(Value))

2- change Number formatting for measure from auto to Measure Expression
- Mark as New
- Bookmark
- Subscribe
- Mute
- Subscribe to RSS Feed
- Permalink
- Report Inappropriate Content
1- Use expression with dual. Dual('Sum: '&Sum(Value),Sum(Value))

2- change Number formatting for measure from auto to Measure Expression
- Mark as New
- Bookmark
- Subscribe
- Mute
- Subscribe to RSS Feed
- Permalink
- Report Inappropriate Content
Hi @SkitzN27
Try with Dual function
Dual('Sum :' & Num(Sum({<Dim=>}Value),'#,##0'), Sum({<Dim=>}Value))
Number formatting: Measure Expression
Hope it helps
Please close the thread by marking correct answer & give likes if you like the post.
- Mark as New
- Bookmark
- Subscribe
- Mute
- Subscribe to RSS Feed
- Permalink
- Report Inappropriate Content
- Mark as New
- Bookmark
- Subscribe
- Mute
- Subscribe to RSS Feed
- Permalink
- Report Inappropriate Content
Thanks so much!
