Unlock a world of possibilities! Login now and discover the exclusive benefits awaiting you.
- Qlik Community
- :
- Forums
- :
- Analytics
- :
- New to Qlik Analytics
- :
- Display first day counts hourly in line chart : Ql...
- Subscribe to RSS Feed
- Mark Topic as New
- Mark Topic as Read
- Float this Topic for Current User
- Bookmark
- Subscribe
- Mute
- Printer Friendly Page
- Mark as New
- Bookmark
- Subscribe
- Mute
- Subscribe to RSS Feed
- Permalink
- Report Inappropriate Content
Display first day counts hourly in line chart : Qliksense
Hi,
I want to display Opens count of First day records in each batch in a line chart Hourly. Below is my data
Table:
Load * inline
[
invitation,batchId, firstSendDate,opens,clientID
sdsd,23,'2018-03-22 01:24:23',1,1
2324dsf,23 , ,0,1
sdsd1,23,'2018-03-28 02:24:23',1,1
sdsd2,23,'2018-03-27 01:24:23',1,1
sdsd3,23,'2018-03-26 03:24:23',1,1
sdsd4,23,'2018-03-22 04:24:23',1,1
2324dsf,24, ,0,1
sdsd5,24,'2018-03-18 03:00:23',1,1
sdsd6,56,'2018-03-18 01:24:23',1,2
sdsd7,56,'2018-03-22 05:24:23',1,2
sdsd734,56,'2018-03-22 03:24:23',1,2
sdsd8,57,'2018-03-22 01:24:23',1,2
sdsd9,57,'2018-03-22 02:24:23',1,2
sdsd9,57,'2018-03-17 01:24:23',1,2
sdsd10,58,'2018-03-18 01:24:23',0,2
sdsd11,58,'2018-03-18 02:24:23',1,2
]
Its displaying like below, when i select for batchId = 23, which is wrong.
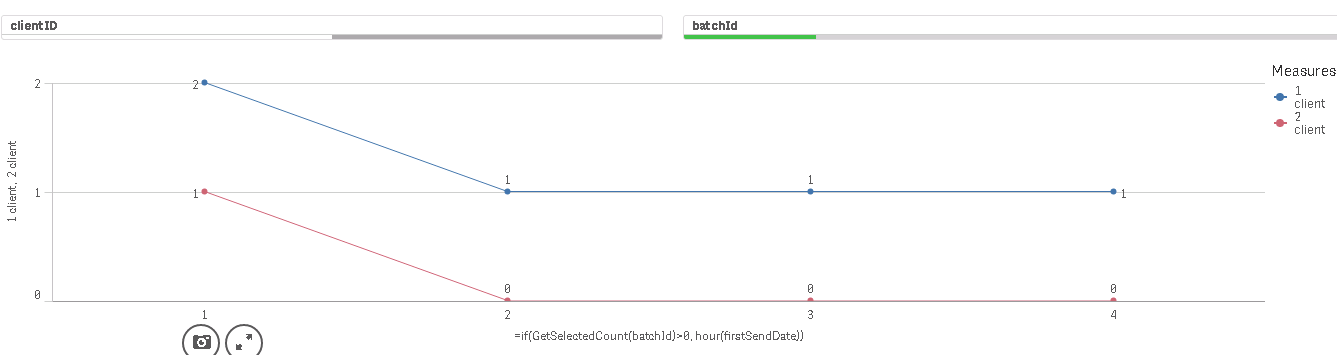
For batchID = 23, It has to display open count = 2 at 2 hour. And it should not display other records in line graph as i have selected only one batch. Below is table explaining openscount for each batch.
| ClientID | batchID | min date | Opens Count |
|---|---|---|---|
| 1 | 23 | 22/03/2018 | 2 |
| 1 | 24 | 18/03/2018 | 1 |
| 2 | 56 | 18/03/2018 | 1 |
| 2 | 57 | 17/03/2018 | 1 |
| 2 | 58 | 18/03/2018 | 1 |
Please help me on this.
- Tags:
- line chart
- Mark as New
- Bookmark
- Subscribe
- Mute
- Subscribe to RSS Feed
- Permalink
- Report Inappropriate Content
format to date hour in load script... Timestamp(firstSendDate, 'DD/HH/YYYY hh') as DateHour
- Mark as New
- Bookmark
- Subscribe
- Mute
- Subscribe to RSS Feed
- Permalink
- Report Inappropriate Content
Hi,
You will want to ensure that the date is converted to a proper date (which it won't be by default coming from an inline) and then calculate the different date parts from that field, the code would be something like:
Table:
LOAD
*,
DayStart(DateTime), 'DD MMM YYYY') as Date,
Hour(DateTime) as Hour,
Minute(DateTime) as Minute,
Month(DateTime) as Month,
Date(MonthStart(DateTime), 'MMM-YY') as MonthYear
;
Load
*,
Date(Date#(firstSendDate, 'YYYY-MM-DD hh:mm:ss') as DateTime
;
inline
[
invitation,batchId, firstSendDate,opens,clientID
sdsd,23,'2018-03-22 01:24:23',1,1
]
;
Having these date parts created in the load script (and there are a lot more you can created besides) will make it easier to build your chart as you will have the dimensions without having to calculate them in the chart.
I don't quite follow what you are trying to achieve. Is it that you only want to show the first value on any given day in the chart for a single batch?
If so you need to flag the first row, do this by creating a key in the load script, adding to the code above as follows:
Data:
LOAD
batchId & '-' & Date(DateTime, 'YYMMDDhhmmss') as UniqueKey,
*,
DayStart(DateTime), 'DD MMM YYYY') as Date,
etc...
Then attach to the first table a flag for when it is the first unique key for that batch:
LEFT JOIN (Data)
LOAD
minstring(UniqueKey) as UniqueKey,
1 as FirstInDay
RESIDENT Data
GROUP BY
batchId
;
Once that has been done in the load script you can modify your chart expression to read:
sum({<FirstInDay={1}>}opens)
This will only include the first value in each day.
To get the first by various different combinations of dimensions, add the dimensions to the unique key and to the group by statement (comma separated).
Hope that makes sense, let me know how you get on.
Steve