Unlock a world of possibilities! Login now and discover the exclusive benefits awaiting you.
- Qlik Community
- :
- Forums
- :
- Analytics
- :
- New to Qlik Analytics
- :
- Display specific value from a date to another
- Subscribe to RSS Feed
- Mark Topic as New
- Mark Topic as Read
- Float this Topic for Current User
- Bookmark
- Subscribe
- Mute
- Printer Friendly Page
- Mark as New
- Bookmark
- Subscribe
- Mute
- Subscribe to RSS Feed
- Permalink
- Report Inappropriate Content
Display specific value from a date to another
Hi Qliker,
I would like to do somethink tricky in my chart. I attached a .qvf to make it easier to understand. In the excel file attached you will have te expected result.
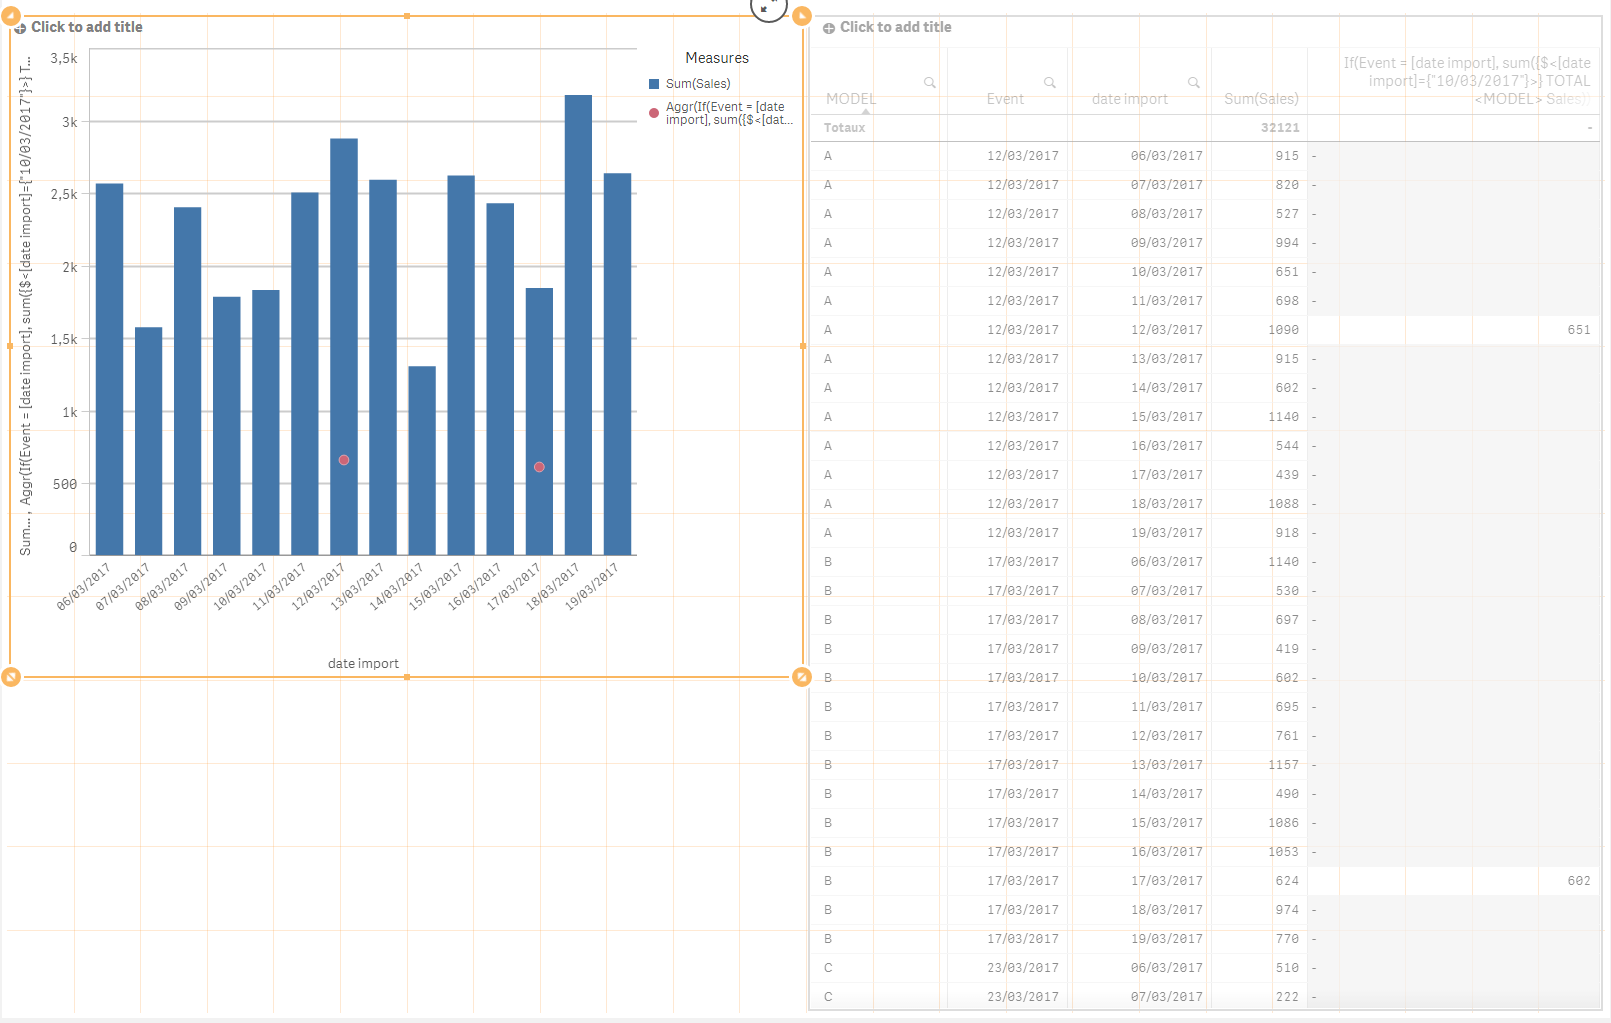
So basically I have 3 MODELS (A,B and C) and the associated sales for each day. What I want to do in my chart is to display the value of sum(sales) from a specific date (here it is 10/03/2017) on another date (date of the "Event").
So in the chart I would like the red dots only on those specifics event dates with the value from another date.
I hope it is more or less clear.
Thanks for your support.
- Tags:
- @ set analysis
Accepted Solutions
- Mark as New
- Bookmark
- Subscribe
- Mute
- Subscribe to RSS Feed
- Permalink
- Report Inappropriate Content
May be this:
Aggr(If(Event = [date import], sum({$<[date import]={"10/03/2017"}>} TOTAL <MODEL> Sales)), MODEL, Event, [date import])
- Mark as New
- Bookmark
- Subscribe
- Mute
- Subscribe to RSS Feed
- Permalink
- Report Inappropriate Content
May be this:
Aggr(If(Event = [date import], sum({$<[date import]={"10/03/2017"}>} TOTAL <MODEL> Sales)), MODEL, Event, [date import])
- Mark as New
- Bookmark
- Subscribe
- Mute
- Subscribe to RSS Feed
- Permalink
- Report Inappropriate Content
Hi Sunny,
This is exactly what I tried to do all friday afternoon and this morning. It looks like you did this very easely if I look the time it took to have your answer.
Is there somewhere a training that explains step by step the logic and the way to use Aggr() and Set analysis? If I look at what I'm finding on the Qlik Sense help site I found it difficult to understand:
https://help.qlik.com/en-US/sense/3.2/Subsystems/Hub/Content/ChartFunctions/aggr.htm
QlikView Technical Brief - AGGR.docx
I'm looking more for a step by step real case example in order to understand how to use this powerfull function.
Best regards
- Mark as New
- Bookmark
- Subscribe
- Mute
- Subscribe to RSS Feed
- Permalink
- Report Inappropriate Content
I tend to break down a problem into smaller pieces... 1st thing you wanted was to pick the value from 10/03/2017 so this expression would do that for you
Sum({$<[date import]={"10/03/2017"}>} Sales)
The above will show only a value next to date import = 10/03/2017. Now next step was to populate this value across all date import within a single MODEL
Sum({$<[date import]={"10/03/2017"}>} TOTAL <MODEL> Sales)
The above will show 10/03/2017 value against all date import
Finally, you wanted to see the 10/03/2017 value where Event = date import, so an if statement
If(Event = [date import], sum({$<[date import]={"10/03/2017"}>} TOTAL <MODEL> Sales))
Now since this is only possible when you have all three dimensions in your chart, I had to force them using Aggr() in your single dimension chart. So, came to this.
Aggr(If(Event = [date import], sum({$<[date import]={"10/03/2017"}>} TOTAL <MODEL> Sales)), MODEL, Event, [date import])
Now if for some reason, multiple MODELs have Event = date import falling on the same date, you will need to use an outer aggregation function such as Sum or Avg or Min or Max based on your requirement
Avg(Aggr(If(Event = [date import], sum({$<[date import]={"10/03/2017"}>} TOTAL <MODEL> Sales)), MODEL, Event, [date import]))
If you don't do this, QlikView won't know which MODEL's value to display from the two values that fall on the same Event = date import dates. You can sum them or average them based on what the requirement is.
Does the above help you understand?
Best,
Sunny
- Mark as New
- Bookmark
- Subscribe
- Mute
- Subscribe to RSS Feed
- Permalink
- Report Inappropriate Content
Hi Sunny,
I thank you for the extrat time you took to explain how you built this expression. I understand better how you built it. And thanks for the warning regarding the fact that an event can have the same date for several MODEL. I will have this for sure in my complete set of data.
Thanks again for your help. It's now time for me to play a little with those functions.
Best regards