Unlock a world of possibilities! Login now and discover the exclusive benefits awaiting you.
- Qlik Community
- :
- Forums
- :
- Analytics
- :
- New to Qlik Analytics
- :
- Re: Displaying dimension based on measure ??
- Subscribe to RSS Feed
- Mark Topic as New
- Mark Topic as Read
- Float this Topic for Current User
- Bookmark
- Subscribe
- Mute
- Printer Friendly Page
- Mark as New
- Bookmark
- Subscribe
- Mute
- Subscribe to RSS Feed
- Permalink
- Report Inappropriate Content
Displaying dimension based on measure ??
Hi All,
I have two measures,
for example Count(Branch), Count(SalesPersons)
I don't have dimension. Based on the measures i have to display that as dimension.
my dimension will be like
Dimension Measures
No.Of Branches 10
No.Of SalesPerson 150
This is possible by using valuelist & creating inline table. Is there any other solution available..????
Thank u.
- Mark as New
- Bookmark
- Subscribe
- Mute
- Subscribe to RSS Feed
- Permalink
- Report Inappropriate Content
Yes, it is possible.
Please find the attached QVW for reference.
Regards
Harish
- Mark as New
- Bookmark
- Subscribe
- Mute
- Subscribe to RSS Feed
- Permalink
- Report Inappropriate Content
Hi
Depending on how you display the measures do you really need a dimension?
For example you could but the expression in a text box and concatenate the title
='No.Of Branches '&Count(Branch)
Dan
- Mark as New
- Bookmark
- Subscribe
- Mute
- Subscribe to RSS Feed
- Permalink
- Report Inappropriate Content
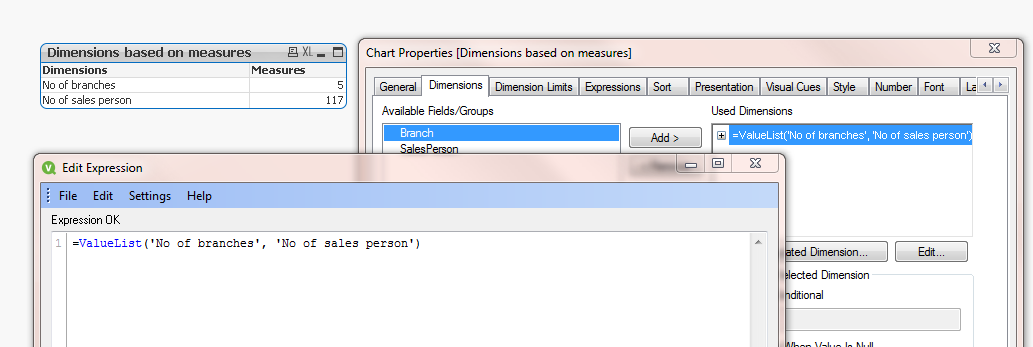
Hi,
You can use ValueList() to create your dimensions, and in the expression you can refer them to do calculations:
I am also attaching a sample app.
Hope this helps.
Thanks
- Mark as New
- Bookmark
- Subscribe
- Mute
- Subscribe to RSS Feed
- Permalink
- Report Inappropriate Content
Hi Simbu,
You can achieve this scenario using a pivot table,
Please have a look at the attachments.
Hope this Helps you.
Thanks,
Lakshmikandh
- Mark as New
- Bookmark
- Subscribe
- Mute
- Subscribe to RSS Feed
- Permalink
- Report Inappropriate Content
Hi All,
Thanks for all your reply,
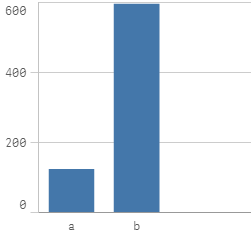
But i need my result in bar chart.
@
- Mark as New
- Bookmark
- Subscribe
- Mute
- Subscribe to RSS Feed
- Permalink
- Report Inappropriate Content
use Valuelist in Dimension as Valuelist( 'No.Of Branches' ,'No.Of SalesPerson' )
In Measures: Pick(wildmatch(Valuelist( 'No.Of Branches' ,'No.Of SalesPerson' ),'No.Of Branches','No.Of SalesPerson'),
sum([No.Of Branches]), sum([No.Of SalesPerson]) )
I hope this is helpful.
- Mark as New
- Bookmark
- Subscribe
- Mute
- Subscribe to RSS Feed
- Permalink
- Report Inappropriate Content
Hi,
Try like this
Dimension: ValueList('No.Of Branches' ,'No.Of SalesPerson' )
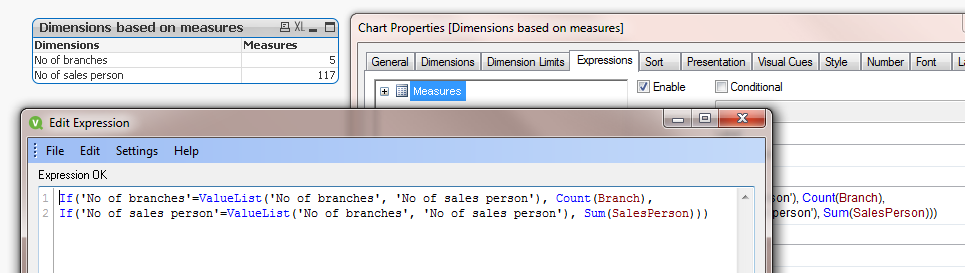
Expression:If(ValueList('No.Of Branches' ,'No.Of SalesPerson' ) = 'No.Of Branches', Count(Branch), Count(SalesPersons))
Hope this helps you.
Regards,
jagan.
- Mark as New
- Bookmark
- Subscribe
- Mute
- Subscribe to RSS Feed
- Permalink
- Report Inappropriate Content
Hi
QlikView
Simply add those 2 expression in bar graph and don't add dimension. it will show you the 2 bars and doesn't depend on dimension since there is no dimension.
Use Text in label option to add a label over there.
For QlikSense
Without dimension bars won't get displayed, so add an empty dimension (something like ='') or use value list.