Unlock a world of possibilities! Login now and discover the exclusive benefits awaiting you.
- Qlik Community
- :
- Forums
- :
- Analytics
- :
- New to Qlik Analytics
- :
- Editing a visualization after publishing
- Subscribe to RSS Feed
- Mark Topic as New
- Mark Topic as Read
- Float this Topic for Current User
- Bookmark
- Subscribe
- Mute
- Printer Friendly Page
- Mark as New
- Bookmark
- Subscribe
- Mute
- Subscribe to RSS Feed
- Permalink
- Report Inappropriate Content
Editing a visualization after publishing
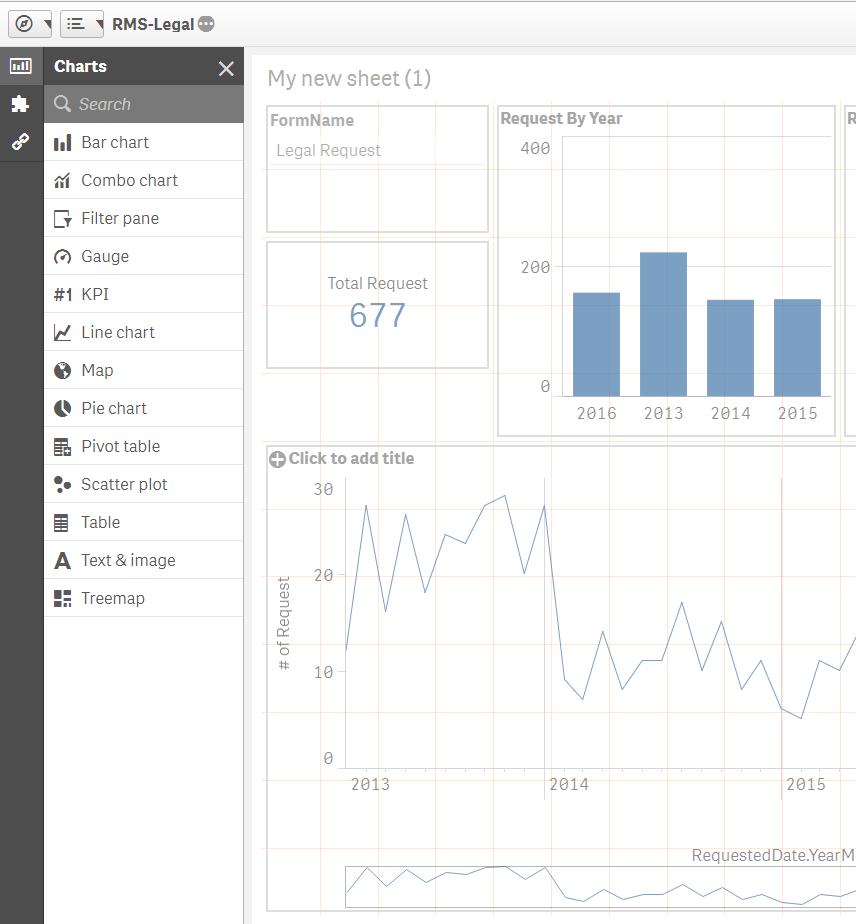
I have an app that is published in Qlik Sense. When i open the app and go to edit a sheet it asks me to make a duplicate. (That is fine as it is what i expected). My problem is when i go to edit my duplicated sheet I only see the options for Charts, Custom Items, and Master Items, I do not see the Fields box in order to change my visualizations.
So my question is, does that meet expectations or are my settings wrong somewhere? I was under the impression that i could edit my duplicated sheet to change that data that is shown in a visualization.
I attached a screenshot for an example: if i want to change the bar graph from Year to Days, i don't have access to my fields to change the layout of the bar graph.
Accepted Solutions
- Mark as New
- Bookmark
- Subscribe
- Mute
- Subscribe to RSS Feed
- Permalink
- Report Inappropriate Content
You don't have direct access to fields so you can't see any fields option in left pane. But you can change dimension by deleting current one in chart and then click "Add Dimension" and there in dropdown you will have access to every dimension.