Unlock a world of possibilities! Login now and discover the exclusive benefits awaiting you.
- Qlik Community
- :
- Forums
- :
- Analytics
- :
- New to Qlik Analytics
- :
- Excel Calculations in Qlik Backend Script Help
- Subscribe to RSS Feed
- Mark Topic as New
- Mark Topic as Read
- Float this Topic for Current User
- Bookmark
- Subscribe
- Mute
- Printer Friendly Page
- Mark as New
- Bookmark
- Subscribe
- Mute
- Subscribe to RSS Feed
- Permalink
- Report Inappropriate Content
Excel Calculations in Qlik Backend Script Help
Hi Experts,
Can any one please help me on below requirement.
In the below attached excel I have the Raw data from Column A to P. From these columns need to derive Column P to U.
The calculations are included in the below excel.
Please help me to calculate the Columns from P to U in the backend only. The data is aggregated by Reporting Date, Date, Name and Folder.
Please find the below attached excel file and expected output.
Accepted Solutions
- Mark as New
- Bookmark
- Subscribe
- Mute
- Subscribe to RSS Feed
- Permalink
- Report Inappropriate Content
Hi,
Please looak at the attached qvf file.
G.
base:
Load * inline
[Reporting Date|Date|Name|Folder|Value|Item1|Item2|Item3|Item4|Item5|Item6|Item7|Item8|Item9|Item10|Item11
2018.09.11|2018.04.29|aim1|MAD|-13 697 056|0|0|0|5 589 217|13 623 768|13 623 768|12 565 927|12 565 927|||
2018.09.11|2017.04.22|aim1|MAD|58 207 976|10 948 770|15 046 180|25 461 408|36 004 973|51 909 039|80 770 242|94 078 344|111 917 257|||
2018.09.11|2018.04.29|aim1|LON|13 498 721|3 726 187|5 460 936|9 312 497|13 813 778|18 751 314|18 751 314|19 100 364|23 127 172|23 127 172|21 357 497|
2018.09.11|2018.03.06|aim1|LON|1 061 991|3 357 008|5 011 881|8 088 991|11 826 557|14 888 460|15 981 164|11 992 469|9 783 912|||
2018.09.11|2018.03.30|aim1|LON|-245 993|3 091 040|4 713 659|7 786 731|11 657 347|16 424 873|16 424 873|17 307 284|18 834 922|||
2018.09.11|2018.04.30|aim1|LON|-4 372 550|4 931 051|8 168 901|14 055 985|21 125 798|37 089 733|53 236 835|56 503 792|73 688 998|||
2018.09.11|2016.09.25|aim1|LON|29 392 098|8 342 825|11 551 983|19 089 361|26 891 764|34 460 667|57 473 772|65 559 470|76 979 238|||
2018.09.11|2012.06.05|aim1|LON|-8 217 008|1 670 430|7 023 089|15 171 330|26 166 680|35 825 013|57 777 584|71 250 167|99 168 824|99 168 824||
] (delimiter is '|');


Calcolumns_tmp:
Load
 "Reporting Date",
    Name,
    Folder,
    if(Value<0,0,Value)+RangeMax(Item1,Item2,Item3,Item4,Item5,Item6,Item7,Item8,Item9,Item10,Item11)/5+0.1 as CalColumn1,
    -if(Value>0,0,Value)+RangeMax(Item1,Item2,Item3,Item4,Item5,Item6,Item7,Item8,Item9,Item10,Item11)/5+0.1 as CalColumn2
Resident base;


Left join(Calcolumns_tmp)
Load
 sum(CalColumn1) as CalColumn1_sum,
    sum(CalColumn2) as CalColumn2_sum
Resident Calcolumns_tmp;


Left join(Calcolumns_tmp)
Load
 Folder,
    sum(CalColumn1) as CalColumn1_foldersum,
    sum(CalColumn2) as CalColumn2_foldersum
Resident Calcolumns_tmp
Group by Folder;


Calcolumns:
Load
 RowNo() as RowNum,
 "Reporting Date",
    Name,
    Folder,
    CalColumn1,
    CalColumn2,
    CalColumn1_foldersum/CalColumn1_sum as CalColumn1Percent,
    CalColumn2_foldersum/CalColumn2_sum as CalColumn2Percent
Resident Calcolumns_tmp;


drop table base, Calcolumns_tmp;
- Mark as New
- Bookmark
- Subscribe
- Mute
- Subscribe to RSS Feed
- Permalink
- Report Inappropriate Content
Try this with your data connection:
Temp:
CrossTable(Item, ValueItem,5)
LOAD
    "Reporting Date",
    "Date",
    Name,
    Folder,
    Value,
    Item1,
    Item2,
    Item3,
    Item4,
    Item5,
    Item6,
    Item7,
    Item8,
    Item9,
    Item10,
    Item11
    FROM [lib://Desktop (quynguyen_ducquy)/Source file.xlsx]
(ooxml, embedded labels, table is Sheet1);


CalTable:
Load *,
 If(Value > 0, Value, 0) + ValueItemMax/5 + 0.1 As Cal1,
     If(Value < 0, Value*-1, 0) + ValueItemMax/5 + 0.1 As Cal2;
Load "Reporting Date",
    "Date",
    Name,
    Folder,
    Value,
    Max(ValueItem) As ValueItemMax
Resident Temp
Group by
 "Reporting Date",    "Date",    Name,    Folder,    Value;
Drop Table Temp;


AggrTable:
Load "Reporting Date",
    Name,
    Folder,
    Sum(Cal1) As Cal1,
    Sum(Cal2) As Cal2
Resident CalTable
Group by "Reporting Date",    Name,    Folder;
Join
Load "Reporting Date",
    Name,
    Sum(Cal1) As Cal1_Total,
    Sum(Cal2) As Cal2_Total
Resident CalTable
Group by "Reporting Date",    Name;


Final_Data:
Load
 "Reporting Date",
    Name,
    Folder,
    Cal1,
    Cal2
Resident CalTable;
Inner Join
Load "Reporting Date",
    Name,
    Folder,
    Cal1/Cal1_Total,
 Cal2/Cal2_Total
Resident AggrTable;
Drop Table CalTable, AggrTable;
- Mark as New
- Bookmark
- Subscribe
- Mute
- Subscribe to RSS Feed
- Permalink
- Report Inappropriate Content
Hi,
Please looak at the attached qvf file.
G.
base:
Load * inline
[Reporting Date|Date|Name|Folder|Value|Item1|Item2|Item3|Item4|Item5|Item6|Item7|Item8|Item9|Item10|Item11
2018.09.11|2018.04.29|aim1|MAD|-13 697 056|0|0|0|5 589 217|13 623 768|13 623 768|12 565 927|12 565 927|||
2018.09.11|2017.04.22|aim1|MAD|58 207 976|10 948 770|15 046 180|25 461 408|36 004 973|51 909 039|80 770 242|94 078 344|111 917 257|||
2018.09.11|2018.04.29|aim1|LON|13 498 721|3 726 187|5 460 936|9 312 497|13 813 778|18 751 314|18 751 314|19 100 364|23 127 172|23 127 172|21 357 497|
2018.09.11|2018.03.06|aim1|LON|1 061 991|3 357 008|5 011 881|8 088 991|11 826 557|14 888 460|15 981 164|11 992 469|9 783 912|||
2018.09.11|2018.03.30|aim1|LON|-245 993|3 091 040|4 713 659|7 786 731|11 657 347|16 424 873|16 424 873|17 307 284|18 834 922|||
2018.09.11|2018.04.30|aim1|LON|-4 372 550|4 931 051|8 168 901|14 055 985|21 125 798|37 089 733|53 236 835|56 503 792|73 688 998|||
2018.09.11|2016.09.25|aim1|LON|29 392 098|8 342 825|11 551 983|19 089 361|26 891 764|34 460 667|57 473 772|65 559 470|76 979 238|||
2018.09.11|2012.06.05|aim1|LON|-8 217 008|1 670 430|7 023 089|15 171 330|26 166 680|35 825 013|57 777 584|71 250 167|99 168 824|99 168 824||
] (delimiter is '|');


Calcolumns_tmp:
Load
 "Reporting Date",
    Name,
    Folder,
    if(Value<0,0,Value)+RangeMax(Item1,Item2,Item3,Item4,Item5,Item6,Item7,Item8,Item9,Item10,Item11)/5+0.1 as CalColumn1,
    -if(Value>0,0,Value)+RangeMax(Item1,Item2,Item3,Item4,Item5,Item6,Item7,Item8,Item9,Item10,Item11)/5+0.1 as CalColumn2
Resident base;


Left join(Calcolumns_tmp)
Load
 sum(CalColumn1) as CalColumn1_sum,
    sum(CalColumn2) as CalColumn2_sum
Resident Calcolumns_tmp;


Left join(Calcolumns_tmp)
Load
 Folder,
    sum(CalColumn1) as CalColumn1_foldersum,
    sum(CalColumn2) as CalColumn2_foldersum
Resident Calcolumns_tmp
Group by Folder;


Calcolumns:
Load
 RowNo() as RowNum,
 "Reporting Date",
    Name,
    Folder,
    CalColumn1,
    CalColumn2,
    CalColumn1_foldersum/CalColumn1_sum as CalColumn1Percent,
    CalColumn2_foldersum/CalColumn2_sum as CalColumn2Percent
Resident Calcolumns_tmp;


drop table base, Calcolumns_tmp;
- Mark as New
- Bookmark
- Subscribe
- Mute
- Subscribe to RSS Feed
- Permalink
- Report Inappropriate Content
The sample application:
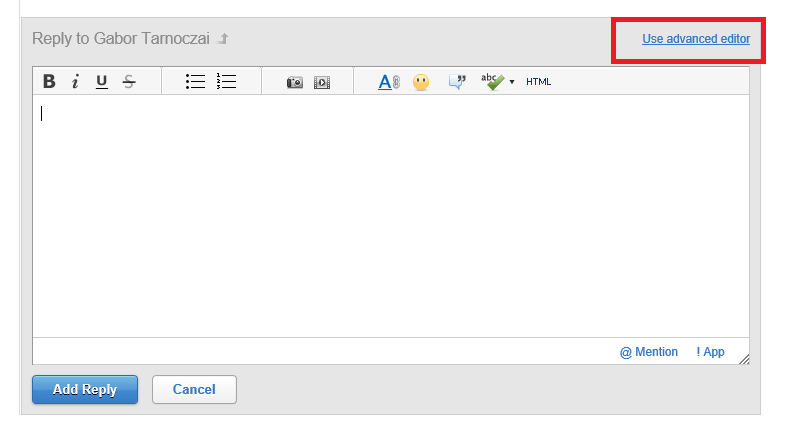
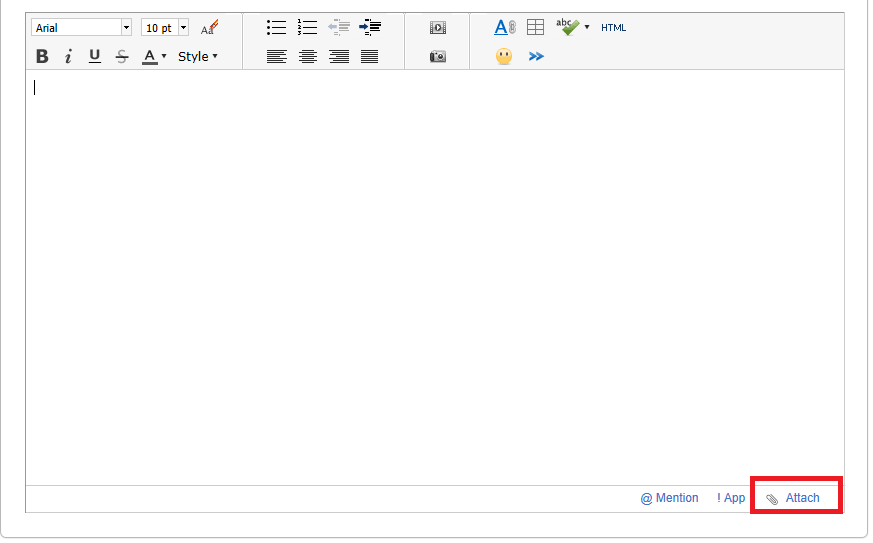
Postscript: How can I upload file directly to the thread?
G.
- Mark as New
- Bookmark
- Subscribe
- Mute
- Subscribe to RSS Feed
- Permalink
- Report Inappropriate Content
Hi undergrinder
Could you please attach the app in thread by removing in Forum.
You can upload the file by clicking on Use advanced editor.
- Mark as New
- Bookmark
- Subscribe
- Mute
- Subscribe to RSS Feed
- Permalink
- Report Inappropriate Content
Thank you very much 
- Mark as New
- Bookmark
- Subscribe
- Mute
- Subscribe to RSS Feed
- Permalink
- Report Inappropriate Content