Unlock a world of possibilities! Login now and discover the exclusive benefits awaiting you.
- Qlik Community
- :
- Forums
- :
- Analytics
- :
- New to Qlik Analytics
- :
- Exporting with filter
Options
- Subscribe to RSS Feed
- Mark Topic as New
- Mark Topic as Read
- Float this Topic for Current User
- Bookmark
- Subscribe
- Mute
- Printer Friendly Page
Turn on suggestions
Auto-suggest helps you quickly narrow down your search results by suggesting possible matches as you type.
Showing results for
Anonymous
Not applicable
2018-04-19
04:23 AM
- Mark as New
- Bookmark
- Subscribe
- Mute
- Subscribe to RSS Feed
- Permalink
- Report Inappropriate Content
Exporting with filter
Hello everybody, hope you are fine 
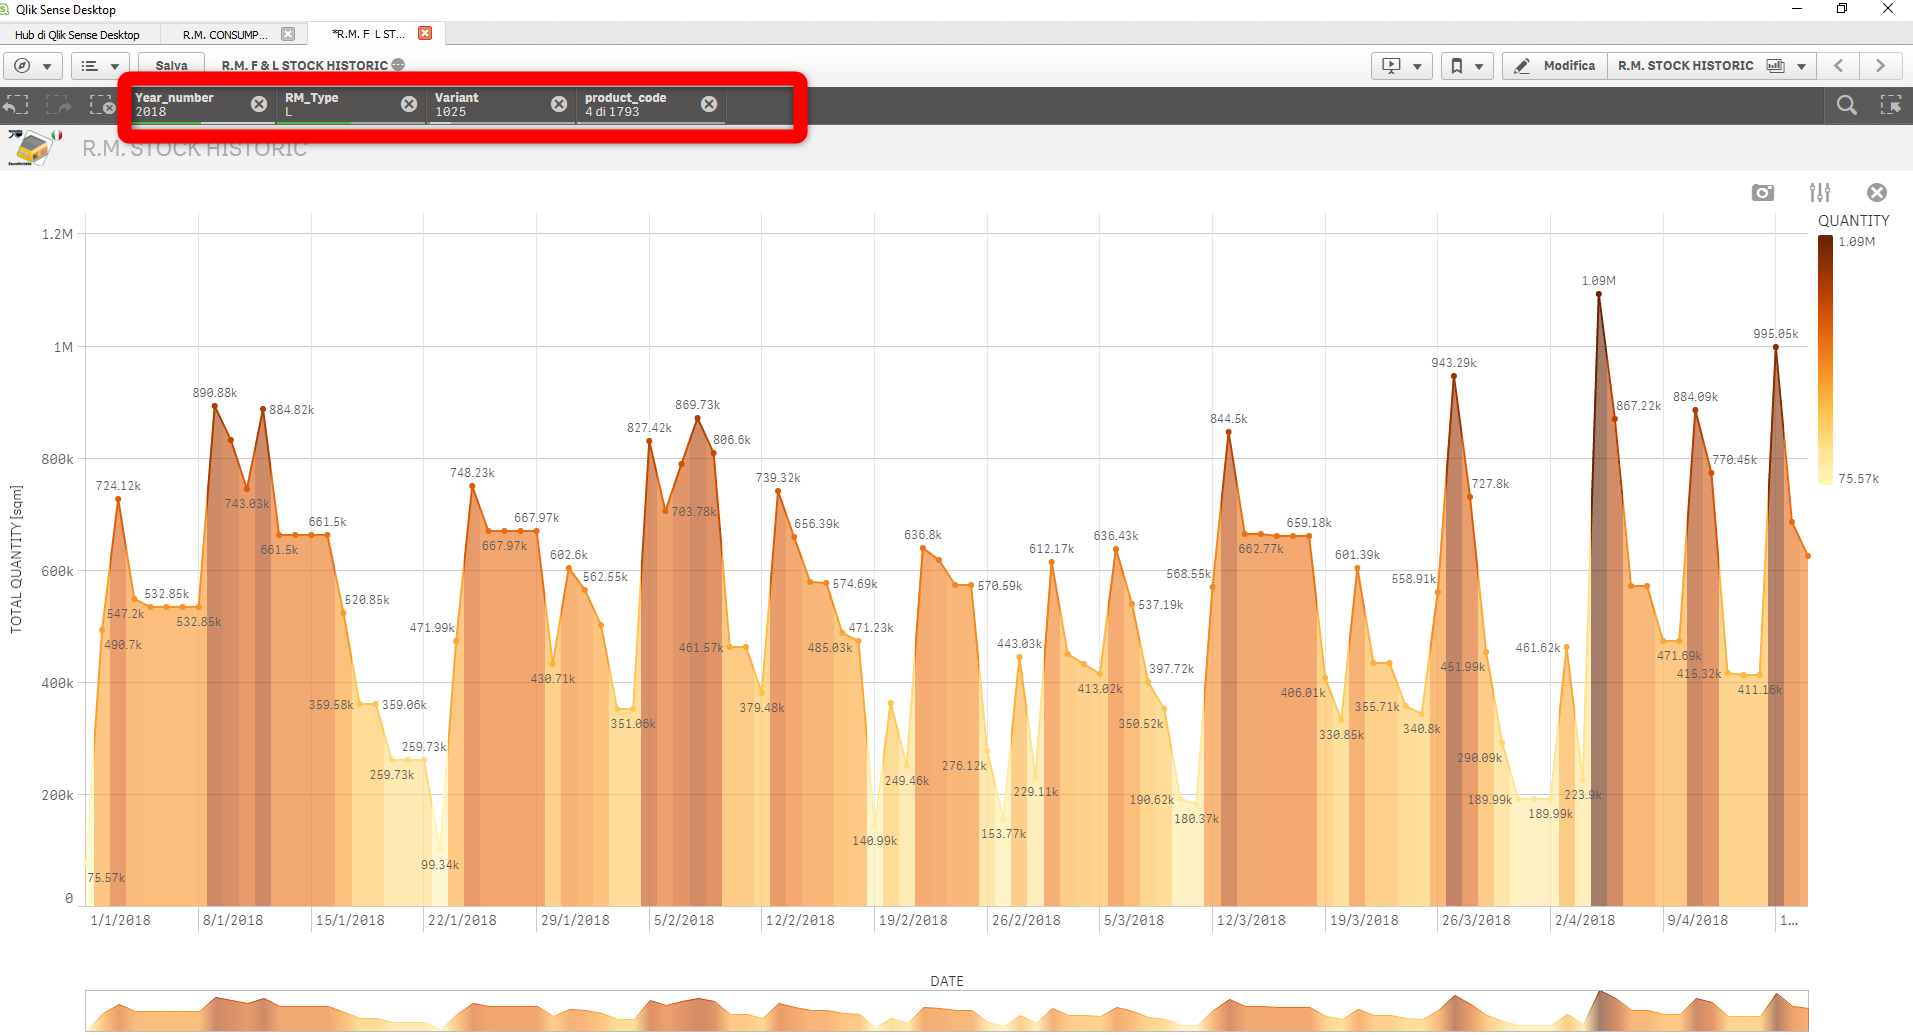
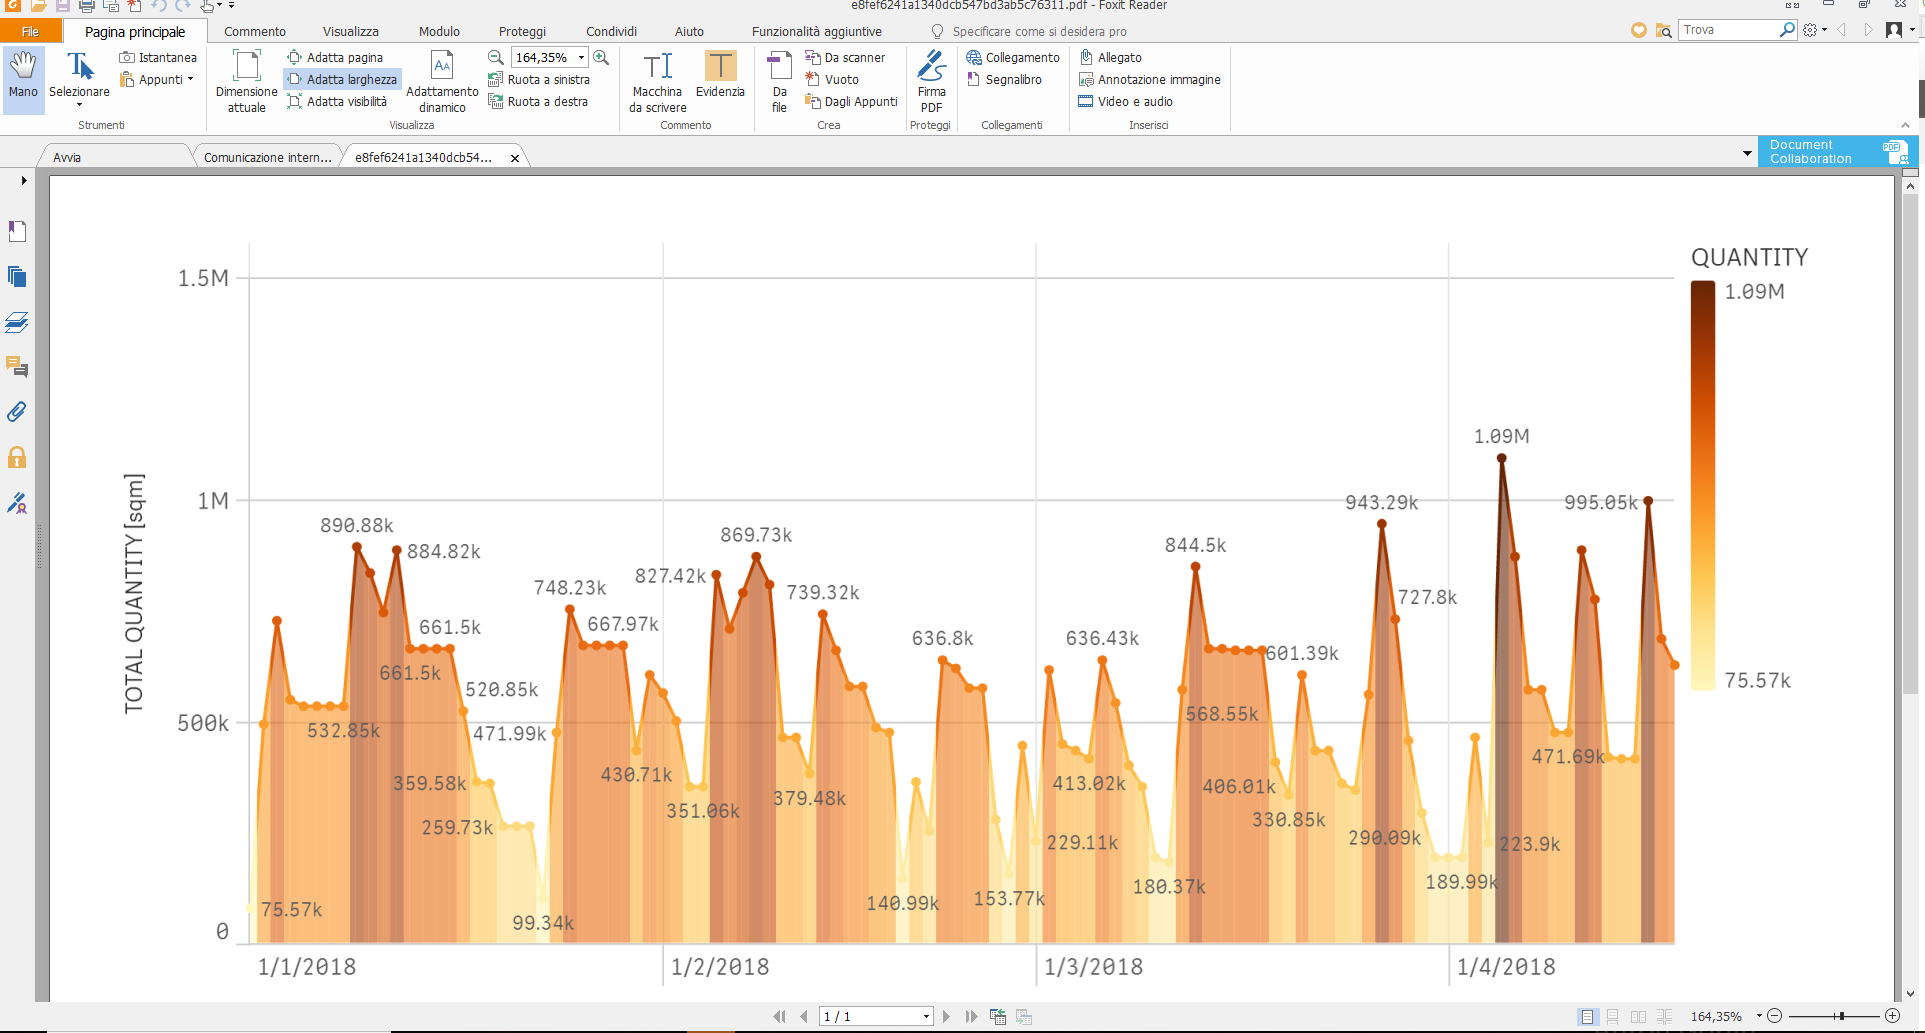
I am using Qlick sense Desktop , In Qlik is there a possibility to see the filtered data on the graph? I mean when you are filtering there is a bar on the top shows the filtered items and bellow the information or the graph are shown according to the filters, once you want to export the the graph nobody knows what the graph is about , I want to show the filtered infrmartion in a label show in the graph while exporting the graph in the PDF, you can see the pictues to better underestand. Thanks
4,757 Views
- « Previous Replies
- Next Replies »
20 Replies
Contributor II
2019-06-26
12:51 PM
- Mark as New
- Bookmark
- Subscribe
- Mute
- Subscribe to RSS Feed
- Permalink
- Report Inappropriate Content
Hi!
No, no answer yet.
No, no answer yet.
256 Views
- « Previous Replies
- Next Replies »
Community Browser