Unlock a world of possibilities! Login now and discover the exclusive benefits awaiting you.
- Qlik Community
- :
- Forums
- :
- Analytics
- :
- New to Qlik Analytics
- :
- Filter pane selections
Options
- Subscribe to RSS Feed
- Mark Topic as New
- Mark Topic as Read
- Float this Topic for Current User
- Bookmark
- Subscribe
- Mute
- Printer Friendly Page
Turn on suggestions
Auto-suggest helps you quickly narrow down your search results by suggesting possible matches as you type.
Showing results for
Not applicable
2017-03-30
05:05 AM
- Mark as New
- Bookmark
- Subscribe
- Mute
- Subscribe to RSS Feed
- Permalink
- Report Inappropriate Content
Filter pane selections
Hello All,
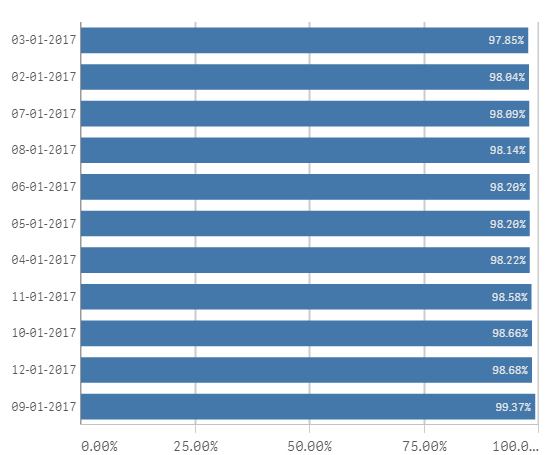
I have created a graph that gives me the compliance of some service each day. I use the following measure to calculate the compliance
(count(total_readings) - count(Successful) ) / count(total_readings)
With this I get the below bar chart. I want to have a filter pane with selections as '98 to 100' , '96 to 98' , '94 to 96' and so on... so that only dates with the matching compliance shows up
165 Views
0 Replies
Community Browser