Unlock a world of possibilities! Login now and discover the exclusive benefits awaiting you.
- Qlik Community
- :
- Forums
- :
- Analytics
- :
- New to Qlik Analytics
- :
- Re: Filtering a table in QSense
- Subscribe to RSS Feed
- Mark Topic as New
- Mark Topic as Read
- Float this Topic for Current User
- Bookmark
- Subscribe
- Mute
- Printer Friendly Page
- Mark as New
- Bookmark
- Subscribe
- Mute
- Subscribe to RSS Feed
- Permalink
- Report Inappropriate Content
Filtering a table in QSense
Hello everybody
Im totally new to QlikSense and these days Im trying to figure out how to use this fantastic tool.
I created a simple table with one dimension and some measures and tried to filter it by one column's (measure) value.
Basically, I just want the chart to show me only values with percentage greater than X.
For me it sounds basic, but after some searches here i understood that its not that easy to create this kind of filter.
I tried to create an expression with result of 1 or 0 and then hide nulls, but the "show nulls" is available only in dimensions.
Does anyone know if there is a solution for that? or it requires an extension?
Thanks a lot
Dolev
Accepted Solutions
- Mark as New
- Bookmark
- Subscribe
- Mute
- Subscribe to RSS Feed
- Permalink
- Report Inappropriate Content
You can do it this way:
in dimension:
=if(aggr(YourMeasure, YourDimension)>X,YourDimension,null())
in measue:
=YourMeasure
Then you can manipulate "Include null values" in the dimension field.
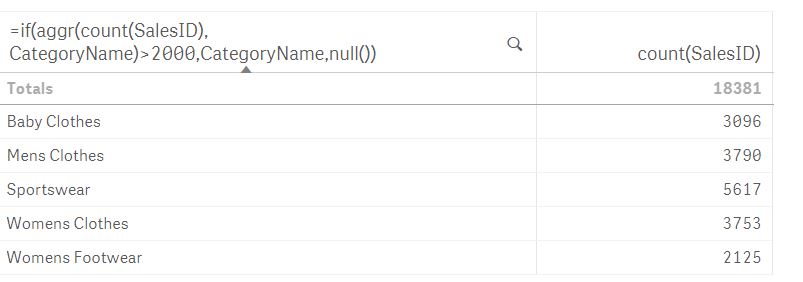
e.g.:
code in the dimension field:
=if(aggr(count(SalesID), CategoryName)>2000,CategoryName,null())
code in the measure field:
=count(SalesID)
- Mark as New
- Bookmark
- Subscribe
- Mute
- Subscribe to RSS Feed
- Permalink
- Report Inappropriate Content
- Mark as New
- Bookmark
- Subscribe
- Mute
- Subscribe to RSS Feed
- Permalink
- Report Inappropriate Content
Hi Beck
Thanks for the answer, but currently i would prefer a solution that doesnt require an extension, if possible 
- Mark as New
- Bookmark
- Subscribe
- Mute
- Subscribe to RSS Feed
- Permalink
- Report Inappropriate Content
You can do it this way:
in dimension:
=if(aggr(YourMeasure, YourDimension)>X,YourDimension,null())
in measue:
=YourMeasure
Then you can manipulate "Include null values" in the dimension field.
e.g.:
code in the dimension field:
=if(aggr(count(SalesID), CategoryName)>2000,CategoryName,null())
code in the measure field:
=count(SalesID)
- Mark as New
- Bookmark
- Subscribe
- Mute
- Subscribe to RSS Feed
- Permalink
- Report Inappropriate Content
Wow, thank you very much!
I was struggling with that so long.
Thanks!
- Mark as New
- Bookmark
- Subscribe
- Mute
- Subscribe to RSS Feed
- Permalink
- Report Inappropriate Content
No problem
Unfortunately, QS' syntax is not so intuitive and 'friendly' as we wish..