Unlock a world of possibilities! Login now and discover the exclusive benefits awaiting you.
- Qlik Community
- :
- Forums
- :
- Analytics
- :
- New to Qlik Analytics
- :
- Re: Find Prev Quarter (Pick in Time)
- Subscribe to RSS Feed
- Mark Topic as New
- Mark Topic as Read
- Float this Topic for Current User
- Bookmark
- Subscribe
- Mute
- Printer Friendly Page
- Mark as New
- Bookmark
- Subscribe
- Mute
- Subscribe to RSS Feed
- Permalink
- Report Inappropriate Content
Find Prev Quarter (Pick in Time)
I have a data table with Metrics and Value per Network.
Each Quarter is labeled with a QuarterID, inspired by the Pick In Time post here (The Magic of Set Analysis - Point In Time Reporting • Blog • AfterSync)
Somehow I don't get it to work, meaning : per row displaying a specific Quarters value and Previous Quarter's value
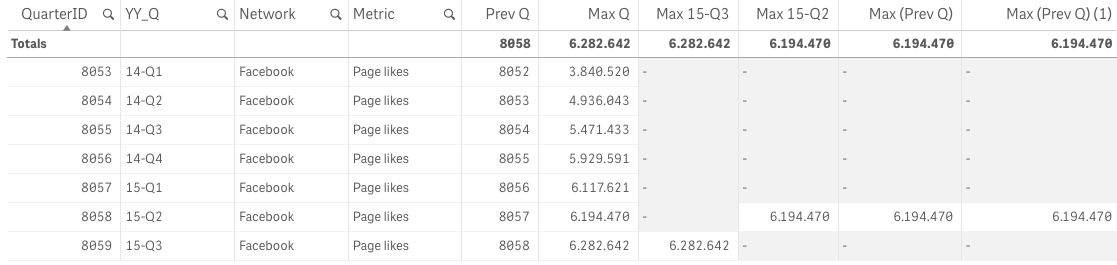
My current expressions are
- Prev Q : Max(QuarterID) - 1
- Max Q : Max(ds_value)
- Max 15-Q3 : max({<YY_Q={'15-Q3'}>} ds_value)
- Max 15-Q2 : max({<YY_Q={'15-Q2'}>} ds_value)
- Max (Prev Q) : max({$<QuarterID = {$(=Max(QuarterID) - 1)}>} ds_value)
- Max (Prev Q)(1) : Max(aggr(max({$<QuarterID = {$(=Max(QuarterID) - 1)} >} ds_value), ds_value))
What are the appropriate expressions for Max 15-Q3, Max 15-Q2, Max (Prev Q) to get values in all the Cells?
- Tags:
- comparativeanalysis
Accepted Solutions
- Mark as New
- Bookmark
- Subscribe
- Mute
- Subscribe to RSS Feed
- Permalink
- Report Inappropriate Content
The set of a set analysis expression is calculated at the chart level, not the row level. So max(QuarterID)-1 will be 8058 for each row in the chart. So any expression using {$<QuarterID = {$(=Max(QuarterID))}>} - will only return a value for the row where QuarterID is 8058.
If you don't need the quarter as a chart dimension then simply remove QuarterID and YY_Q from the chart.
If you need the quarter as a chart dimension then there are several solutions. The easiest in my opinion is an AsOf table. See this document for more information and examples: Calculating rolling n-period totals, averages or other aggregations. In your case you'll need to link each quarter only with its previous quarter.
talk is cheap, supply exceeds demand
- Mark as New
- Bookmark
- Subscribe
- Mute
- Subscribe to RSS Feed
- Permalink
- Report Inappropriate Content
For the two static max values you can use TOTAL qualifier:
- Max 15-Q3 : max(TOTAL {<YY_Q={'15-Q3'}>} ds_value)
- Max 15-Q2 : max(TOTAL {<YY_Q={'15-Q2'}>} ds_value)
To get max ds_value from the previous quarter, you can use chart inter record functions:
=Above( Max(ds_value) )
- Mark as New
- Bookmark
- Subscribe
- Mute
- Subscribe to RSS Feed
- Permalink
- Report Inappropriate Content
Thanks gwassenaar and swuehl! Both of your answers where very helpfull.
The TOTAL qualifier helped me displaying the cells in allt rows for Max 15-Q3 and Max 15-Q2.
For the previous quarter value, I actually did use the AsOf approach, since the actual data table has much more entries and dimensions.
Both is working fine now, perfect!
Thanks
- Edwin