Unlock a world of possibilities! Login now and discover the exclusive benefits awaiting you.
- Qlik Community
- :
- Forums
- :
- Analytics
- :
- New to Qlik Analytics
- :
- Forecasted revenue from the 3 latest values
- Subscribe to RSS Feed
- Mark Topic as New
- Mark Topic as Read
- Float this Topic for Current User
- Bookmark
- Subscribe
- Mute
- Printer Friendly Page
- Mark as New
- Bookmark
- Subscribe
- Mute
- Subscribe to RSS Feed
- Permalink
- Report Inappropriate Content
Forecasted revenue from the 3 latest values
Hi!
I have a table with dates and revenue:
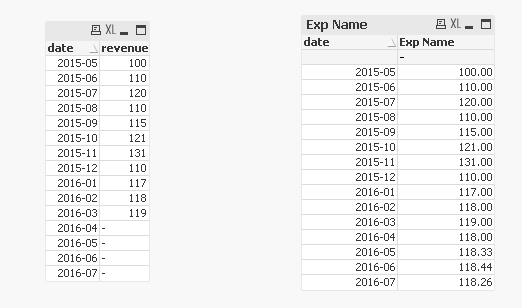
date 2015-05 2015-06 2015-07 2015-08 2015-09 2015-10 2015-11 2015-12 2016-01 2016-02 2016-03 2016-04 2016-05 2016-06 2016-07 ... | revenue 100 110 120 110 115 121 131 110 117 118 119 - - - - ... |
I want to use the three latest values of the selected set to forecast all later values in a line chart. So if no selection is made the value for 2016-04 would be (117+118+119)/3 = 118. The value for 2016-05 would then be (118+119+118)/3 = 118.333 and the value for 2016-06 (119+118+118.333)/3 and so forth. Is it possible to achieve this?
- Mark as New
- Bookmark
- Subscribe
- Mute
- Subscribe to RSS Feed
- Permalink
- Report Inappropriate Content
May be using this:
=If(IsNull(revenue), RangeAvg(Above([Exp Name], 1, 3)), revenue)
This would have issue when you make selections. Would you be able to elaborate on what this should look like after a selection is made in date field?
- Mark as New
- Bookmark
- Subscribe
- Mute
- Subscribe to RSS Feed
- Permalink
- Report Inappropriate Content
Thank you for your answer!
If the value of say 2015-02 was way lower/higher than normal I would like to permit for the possibility of de-selecting that date-value pair and have the forecast calculated from the values of 2015-12, 2016-01 & 2016-03 instead. Or if you would want to show the forecast as it was 2015-11 you should be able to de-select all dates later than 2015-11 and have 2015-12 and the rest forecasted instead.
I don't understand how you get the [Exp Name] table. When I use your script but with [revenue] instead of [Exp Name] as measurement in the line chart the first forecasted value becomes correct. The next forecasted value is the average of the 2 last actual values and the last forecasted value is the same as the last actual value (only 3 values are calculated). Can you explain how to build the [Exp Name] table?
- Mark as New
- Bookmark
- Subscribe
- Mute
- Subscribe to RSS Feed
- Permalink
- Report Inappropriate Content
Update:
I think I'm almost there but the behavior is weird.
I have now created this following variable that I use as measurement in the line chart as $(vFC):
set vFC = If(isnull(revenue), RangeAvg(Above($(vFC), 1, 3)), revenue);
This however doesn't show any data unless I change it to:
set vFC = If(isnull(revenue), RangeAvg(Above('$(vFC)', 1, 3)), revenue); //notice the '' around $(vFC)
When I load the data with the latter variable definition it shows the data but no forecasted values and here comes the weird part:
When I now change the variable to the first definition (after loading the data once with the latter) three (3) forecasted (and correct) values suddenly appears alongside the actual ones.When I load the data a second time three more (6) forecasted (and slightly incorrect) values are shown. And when I load the data again three more (9) forecasted (and slightly more off) values are shown and the three previously created forecasted values gets corrected. For each time I reload the data with the load button three more forecasted values are shown. The later forecasted values that are created after the first load are however slightly off but gets closer and closer to being correct (the average of the three previous values) the more times I reload the data.
Can anyone explain what is going on here??? And more importantly, can anyone solve this and make is work as intended?