Unlock a world of possibilities! Login now and discover the exclusive benefits awaiting you.
- Qlik Community
- :
- Forums
- :
- Analytics
- :
- New to Qlik Analytics
- :
- Forecasting capacity
Options
- Subscribe to RSS Feed
- Mark Topic as New
- Mark Topic as Read
- Float this Topic for Current User
- Bookmark
- Subscribe
- Mute
- Printer Friendly Page
Turn on suggestions
Auto-suggest helps you quickly narrow down your search results by suggesting possible matches as you type.
Showing results for
Contributor
2020-08-07
06:44 AM
- Mark as New
- Bookmark
- Subscribe
- Mute
- Subscribe to RSS Feed
- Permalink
- Report Inappropriate Content
Forecasting capacity
Hi guys,
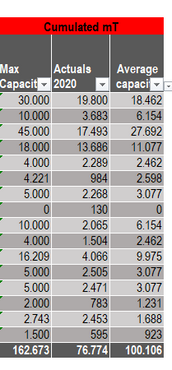
I have maximum capacity and an actual state of the capacity and how much we are allowed to deliver on average every week How can I find out which one will have overcapacity first? And how do I get that visually in a graph?
The dates in this table are on a weekly basis. I have the first 32 weeks of the year, but I want to predict the rest of the year.
226 Views
0 Replies
Community Browser

