Unlock a world of possibilities! Login now and discover the exclusive benefits awaiting you.
- Qlik Community
- :
- Forums
- :
- Analytics
- :
- New to Qlik Analytics
- :
- Re: Full accumulation - showing a period
- Subscribe to RSS Feed
- Mark Topic as New
- Mark Topic as Read
- Float this Topic for Current User
- Bookmark
- Subscribe
- Mute
- Printer Friendly Page
- Mark as New
- Bookmark
- Subscribe
- Mute
- Subscribe to RSS Feed
- Permalink
- Report Inappropriate Content
Full accumulation - showing a period
Hi guys,
I'm facing a problem in my line chart.
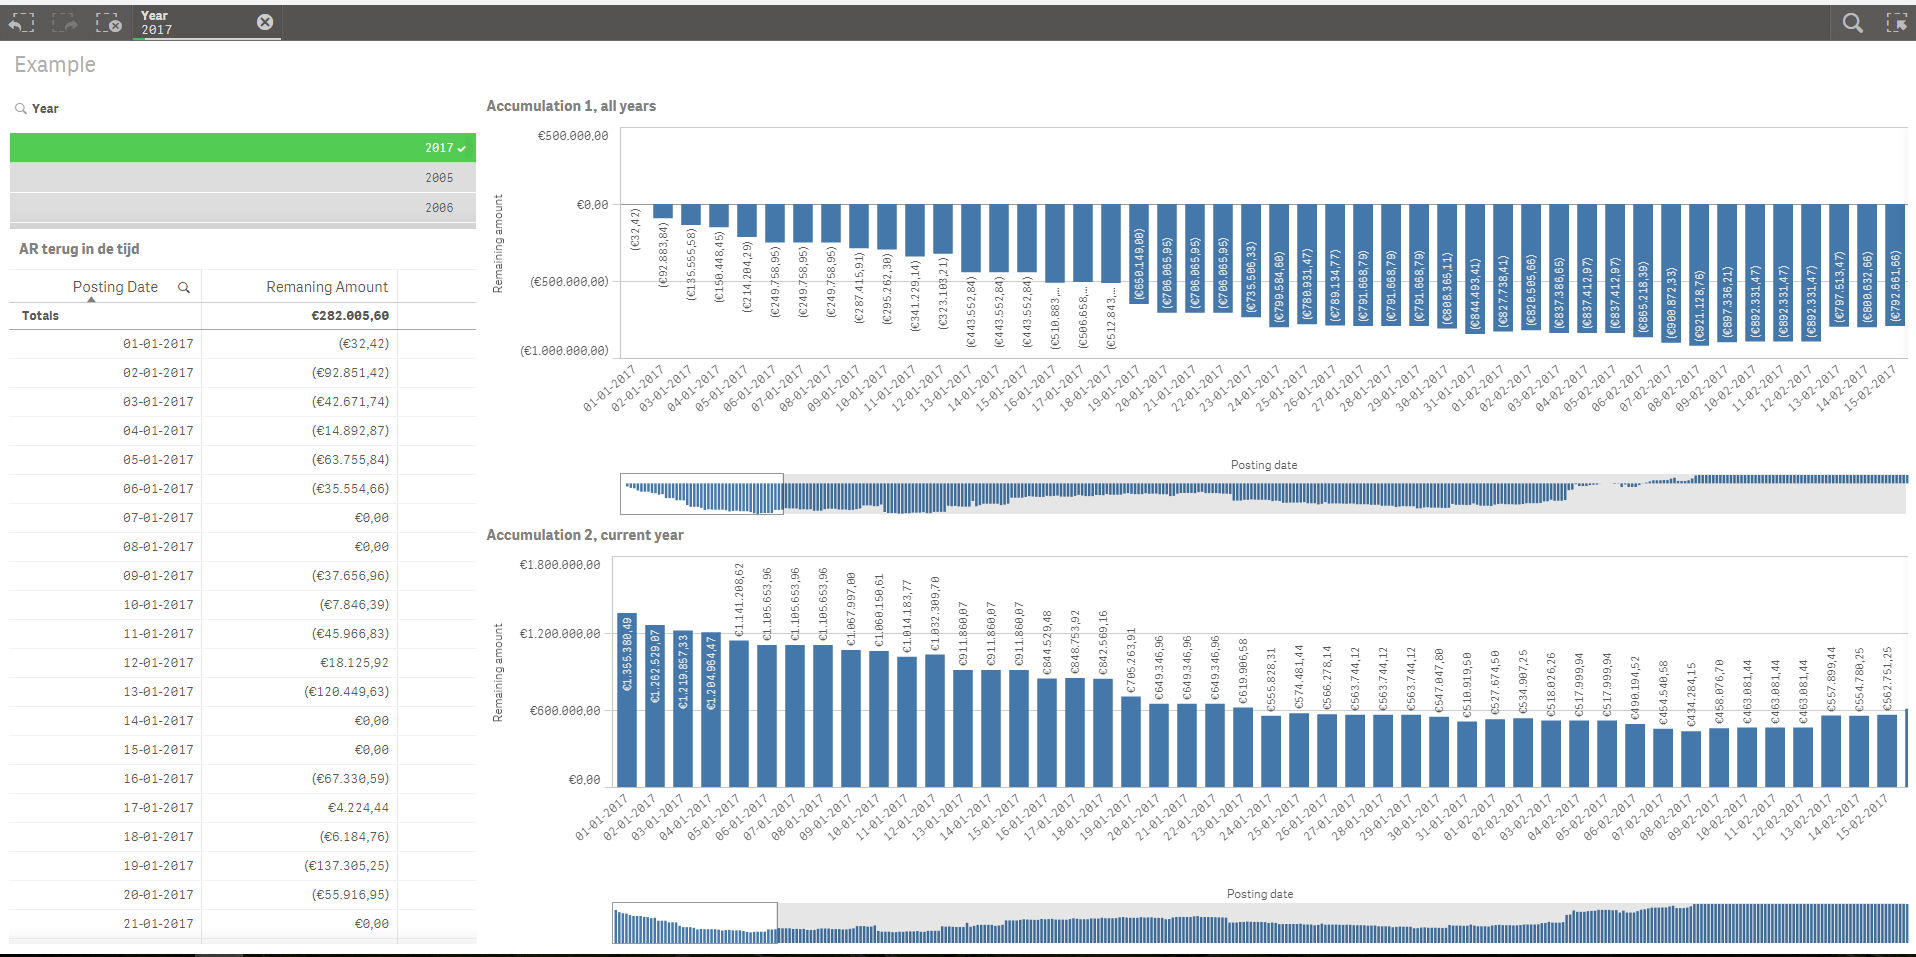
I want to show the accumulated sum of a bank balance, but only for this year.
To do so, I'm using the following script with MonthYear as dimension:
rangesum(above(sum([GL Amount USD]),0,rowno()))
This script is working fine when I'm showing the bank balance as a line chart over all the years in our database.
When I'm selecting to show only the current year, the script above is starting to accumulate with the first month of the current year as starting point.
How could I make a chart where the bank balance is fully accumulated over all the years, but where only the current year is displayed?
Thanks a lot in advance!:)
Cheers,
Mike
- « Previous Replies
- Next Replies »
Accepted Solutions
- Mark as New
- Bookmark
- Subscribe
- Mute
- Subscribe to RSS Feed
- Permalink
- Report Inappropriate Content
You are using calculated dimension, why? Try with Date and select Year = 2017
But if you want to look at only 2017, regardless of selection, then try this
RangeSum(Above(Sum({<Year, Date, MonthYear, Month>}[GL Amount USD]), 0, RowNo())) * Avg({<Year = {2017}>}1)
- Mark as New
- Bookmark
- Subscribe
- Mute
- Subscribe to RSS Feed
- Permalink
- Report Inappropriate Content
Maybe=
rangesum(above(sum({<Year={"$(=Year(Today(1)))"}>}[GL Amount USD]),0,rowno()))
- Mark as New
- Bookmark
- Subscribe
- Mute
- Subscribe to RSS Feed
- Permalink
- Report Inappropriate Content
Thanks for your reply Omar!
Unfortunately this script does the same as I already had.
It starts to accumulate at january 2017, where the starting point should be in April 2009.
Is there a way to select the starting date for the accumulation, but only show the current year?
- Mark as New
- Bookmark
- Subscribe
- Mute
- Subscribe to RSS Feed
- Permalink
- Report Inappropriate Content
Do you experts have an idea for this problem? gwassenaar mto stalwar1
mslottje wrote:
Hi guys,
I'm facing a problem in my line chart.
I want to show the accumulated sum of a bank balance, but only for this year.
To do so, I'm using the following script with MonthYear as dimension:
rangesum(above(sum([GL Amount USD]),0,rowno()))
This script is working fine when I'm showing the bank balance as a line chart over all the years in our database.
When I'm selecting to show only the current year, the script above is starting to accumulate with the first month of the current year as starting point.
How could I make a chart where the bank balance is fully accumulated over all the years, but where only the current year is displayed?
Thanks a lot in advance!:)
Cheers,
Mike
- Mark as New
- Bookmark
- Subscribe
- Mute
- Subscribe to RSS Feed
- Permalink
- Report Inappropriate Content
Try this
RangeSum(Above(Sum({<Year, Date, MonthYear, Month>}[GL Amount USD]), 0, RowNo())) * Avg(1)
- Mark as New
- Bookmark
- Subscribe
- Mute
- Subscribe to RSS Feed
- Permalink
- Report Inappropriate Content
Hi Sunny,
thanks for your help, unfortunately this expression doesn't change the outcome..
Any other ideas?
Or should I create an example file?
Kind regards,
Mike
- Mark as New
- Bookmark
- Subscribe
- Mute
- Subscribe to RSS Feed
- Permalink
- Report Inappropriate Content
Which field are you making selection in?
- Mark as New
- Bookmark
- Subscribe
- Mute
- Subscribe to RSS Feed
- Permalink
- Report Inappropriate Content
I have a line chart with MonthYear as dimension and the expression you gave me as measure.
I've made a selection in the dimension with the following if statement:
if(Year='2017', MonthYear)
- Mark as New
- Bookmark
- Subscribe
- Mute
- Subscribe to RSS Feed
- Permalink
- Report Inappropriate Content
I think the above expression should work... I think if you can share a sample where you can show it isn't working, we might be able to look to see what is wrong
- Mark as New
- Bookmark
- Subscribe
- Mute
- Subscribe to RSS Feed
- Permalink
- Report Inappropriate Content
Hi Sunny,
I'll get back to you later with an example file.
Mike
- « Previous Replies
- Next Replies »