Unlock a world of possibilities! Login now and discover the exclusive benefits awaiting you.
- Qlik Community
- :
- Forums
- :
- Analytics
- :
- New to Qlik Analytics
- :
- Re: Gauge chart (horizontal)
- Subscribe to RSS Feed
- Mark Topic as New
- Mark Topic as Read
- Float this Topic for Current User
- Bookmark
- Subscribe
- Mute
- Printer Friendly Page
- Mark as New
- Bookmark
- Subscribe
- Mute
- Subscribe to RSS Feed
- Permalink
- Report Inappropriate Content
Gauge chart (horizontal)
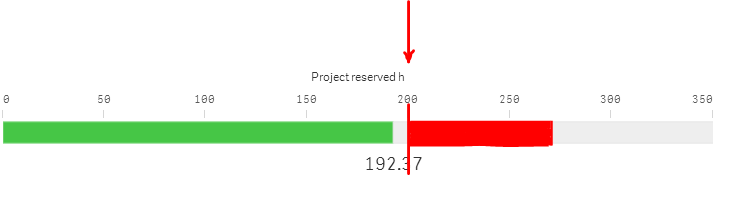
I need to fill the horizontal bar like above. This is working fine, right now the green fill goes up to 192.37
What do I need:
-I need to have a mark at 200 to indicate my target.
-If the value goes above 200 I would need to fill the bar with another color, let's say red. The example above should indicate 265.
I tried segments, and they work only to detect the <200 and >200 but what I need is to fill (color) the bar to a specific level.
Hope this makes sense, thanks!
Accepted Solutions
- Mark as New
- Bookmark
- Subscribe
- Mute
- Subscribe to RSS Feed
- Permalink
- Report Inappropriate Content
Hi Joes
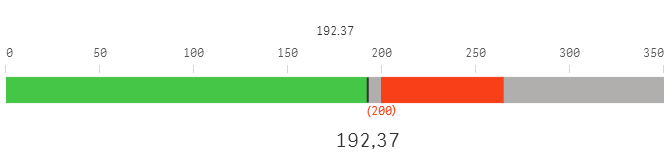
The Mark at 200 can be set using a reference line this can be static e.g. 200 or based on an expression.
It is not possible to do what you want with colours on this gauge. Achievement is marked on the gauge as another line like the reference.
The coloured segments are there to identify when your achievement is moving from one area to another these areas can be set statically or by expression.
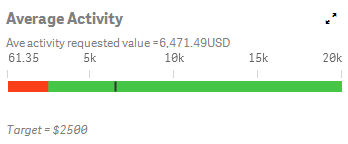
Some things you can do with gauges in the example above I have a lot of gauges on the screen so some of the features of the gauge are missing e.g. Achievement Value which I included myself in the gauge sub header.
I set min and max size if the gauge based on the min/max requested value. Note check for extreme outliers if using this approach.
I used segments to define the target and used the footnote to display the value.
Hope this helps
Regards
Andy
- Mark as New
- Bookmark
- Subscribe
- Mute
- Subscribe to RSS Feed
- Permalink
- Report Inappropriate Content
Hi Joes
The Mark at 200 can be set using a reference line this can be static e.g. 200 or based on an expression.
It is not possible to do what you want with colours on this gauge. Achievement is marked on the gauge as another line like the reference.
The coloured segments are there to identify when your achievement is moving from one area to another these areas can be set statically or by expression.
Some things you can do with gauges in the example above I have a lot of gauges on the screen so some of the features of the gauge are missing e.g. Achievement Value which I included myself in the gauge sub header.
I set min and max size if the gauge based on the min/max requested value. Note check for extreme outliers if using this approach.
I used segments to define the target and used the footnote to display the value.
Hope this helps
Regards
Andy
- Mark as New
- Bookmark
- Subscribe
- Mute
- Subscribe to RSS Feed
- Permalink
- Report Inappropriate Content
Hi Jose,
what about this?
Check the attached app.
- Mark as New
- Bookmark
- Subscribe
- Mute
- Subscribe to RSS Feed
- Permalink
- Report Inappropriate Content
Have you thought about implementing "Bullet Chart" for your analysis?
I saw one in Github, whihc was developed by "Seebach".
seebach/it.BulletChart · GitHub
YOu should try addign this extension to your app. give it a try.