Unlock a world of possibilities! Login now and discover the exclusive benefits awaiting you.
- Qlik Community
- :
- Forums
- :
- Analytics
- :
- New to Qlik Analytics
- :
- Get Alternative Field Value
- Subscribe to RSS Feed
- Mark Topic as New
- Mark Topic as Read
- Float this Topic for Current User
- Bookmark
- Subscribe
- Mute
- Printer Friendly Page
- Mark as New
- Bookmark
- Subscribe
- Mute
- Subscribe to RSS Feed
- Permalink
- Report Inappropriate Content
Get Alternative Field Value
Hello to all,
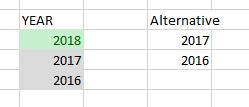
I need to show in a table (or otherwise store on one side).
That is, selecting one or values in a Filter pane, I would like to have a column with alternative values (in light gray).
For example:
Thanks,
Livio
- « Previous Replies
- Next Replies »
Accepted Solutions
- Mark as New
- Bookmark
- Subscribe
- Mute
- Subscribe to RSS Feed
- Permalink
- Report Inappropriate Content
- Mark as New
- Bookmark
- Subscribe
- Mute
- Subscribe to RSS Feed
- Permalink
- Report Inappropriate Content
Hi,
do you mean transform POSSIBLE VALUES to EXCLUDED VALUES ? because light grey on qlik means EXCLUDED VALUES
- Mark as New
- Bookmark
- Subscribe
- Mute
- Subscribe to RSS Feed
- Permalink
- Report Inappropriate Content
I want get Alternative value in a table.
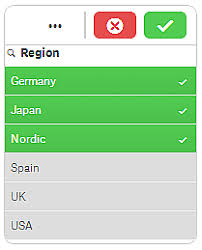
For example: SPAIN,UK and USA.
- Mark as New
- Bookmark
- Subscribe
- Mute
- Subscribe to RSS Feed
- Permalink
- Report Inappropriate Content
Ok
make your selection on the first filterbox, on the second filterbox try this as an expression:
=aggr(Only({<Country=E(Region)>}Region),Region)
- Mark as New
- Bookmark
- Subscribe
- Mute
- Subscribe to RSS Feed
- Permalink
- Report Inappropriate Content
Sorry but i don't understand. I have only 1 dimension. There you are using 2 fields.
- Mark as New
- Bookmark
- Subscribe
- Mute
- Subscribe to RSS Feed
- Permalink
- Report Inappropriate Content
My bad, I was testing it and I forgot to replace all the fields using your field
here you go:
=aggr(Only({<Region=E(Region)>}Region),Region)
- Mark as New
- Bookmark
- Subscribe
- Mute
- Subscribe to RSS Feed
- Permalink
- Report Inappropriate Content
Create a second filter panel and add the expression as Dimension instead of selecting an existing field or dimension.
- Mark as New
- Bookmark
- Subscribe
- Mute
- Subscribe to RSS Feed
- Permalink
- Report Inappropriate Content
I have already tried this expression, but it doesn't work.
The result is the current selection and not the alternative values.
- Mark as New
- Bookmark
- Subscribe
- Mute
- Subscribe to RSS Feed
- Permalink
- Report Inappropriate Content
something is wrong then because it is a tested solution
- Mark as New
- Bookmark
- Subscribe
- Mute
- Subscribe to RSS Feed
- Permalink
- Report Inappropriate Content
would you be able to share sample qvf app ?
- « Previous Replies
- Next Replies »