Unlock a world of possibilities! Login now and discover the exclusive benefits awaiting you.
- Qlik Community
- :
- Forums
- :
- Analytics
- :
- New to Qlik Analytics
- :
- Re: Get counts of calculated meaure in a table
- Subscribe to RSS Feed
- Mark Topic as New
- Mark Topic as Read
- Float this Topic for Current User
- Bookmark
- Subscribe
- Mute
- Printer Friendly Page
- Mark as New
- Bookmark
- Subscribe
- Mute
- Subscribe to RSS Feed
- Permalink
- Report Inappropriate Content
Get counts of calculated meaure in a table
Hi,
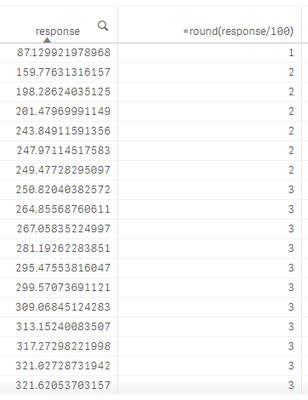
I've made a table like this. I want to add a third column that contain counts of the second column (In this case, from top to bottom that would be: 1,6,6,6,6,6,6,11,11,11,11,11,11,11,11,11,11,11). What expression can I use to accomplish this?
- Mark as New
- Bookmark
- Subscribe
- Mute
- Subscribe to RSS Feed
- Permalink
- Report Inappropriate Content
I think count(distinct(round(response/100))) should work
- Mark as New
- Bookmark
- Subscribe
- Mute
- Subscribe to RSS Feed
- Permalink
- Report Inappropriate Content
remove second expression as measure, create a new dimension(not measure) as round(response/100)
create a third measure as sum(aggr(count(1), round(response/100))
check it works
- Mark as New
- Bookmark
- Subscribe
- Mute
- Subscribe to RSS Feed
- Permalink
- Report Inappropriate Content
If you could create a new dimension like:
Round((response)/100) as response_aggr
Your expression will be:
Count(total <response_aggr> response)
- Mark as New
- Bookmark
- Subscribe
- Mute
- Subscribe to RSS Feed
- Permalink
- Report Inappropriate Content
This is along the lines of what I want, but it produces a column of all 1's
As for the other answers, I wish to do this all in a single measure if possible. In my actual app, the '100' is not fixed. It will be many different values for different chart objects so solving this with a new dimension in the data model is not a viable option.
- Mark as New
- Bookmark
- Subscribe
- Mute
- Subscribe to RSS Feed
- Permalink
- Report Inappropriate Content
Did you check if adding this in measure sum(aggr(count(1), round(response/100)) works? Just take one dimension I.e response.. I am guessing this should
- Mark as New
- Bookmark
- Subscribe
- Mute
- Subscribe to RSS Feed
- Permalink
- Report Inappropriate Content
This produces a column of all 0s. I think this might be close though.
