Unlock a world of possibilities! Login now and discover the exclusive benefits awaiting you.
- Qlik Community
- :
- Forums
- :
- Analytics
- :
- New to Qlik Analytics
- :
- Re: Get data for the last day in a month
- Subscribe to RSS Feed
- Mark Topic as New
- Mark Topic as Read
- Float this Topic for Current User
- Bookmark
- Subscribe
- Mute
- Printer Friendly Page
- Mark as New
- Bookmark
- Subscribe
- Mute
- Subscribe to RSS Feed
- Permalink
- Report Inappropriate Content
Get data for the last day in a month
Hello!
Data sample:
AU_date | Value
01/01/18 | 80
01/02/18 | 150
.....
01/31/18 | 100
....
04/30/18 | 188
I want to create a bar chart with the dimension Last day of a month and a values in these days.
For example:
Last_date | Value
_____________________
01/31/18 | 100
02/28/18 | 180
03/31/18 | 174
04/30/18 | 188
To solve this, I wrote expression:
SUM({S}<AU_Date = {"$(=MonthEnd(AU_Date))"}>, Value)
But, it does not work...
Could you help?
Thank you in advance!
Accepted Solutions
- Mark as New
- Bookmark
- Subscribe
- Mute
- Subscribe to RSS Feed
- Permalink
- Report Inappropriate Content
Set analysis does not get calculated per row. It gets calculated once.
I suggest in your data (master calendar) create a last day of the month flag. And use that in set analysis
- Mark as New
- Bookmark
- Subscribe
- Mute
- Subscribe to RSS Feed
- Permalink
- Report Inappropriate Content
Set analysis does not get calculated per row. It gets calculated once.
I suggest in your data (master calendar) create a last day of the month flag. And use that in set analysis
- Mark as New
- Bookmark
- Subscribe
- Mute
- Subscribe to RSS Feed
- Permalink
- Report Inappropriate Content
I think first you have to create a calculated dimension which is labeled as MonthEnd and use Monthend() on AU_date field. Then, for the expression, only sum(value) is needed, without using any set analysis.
- Mark as New
- Bookmark
- Subscribe
- Mute
- Subscribe to RSS Feed
- Permalink
- Report Inappropriate Content
The next step, which I wanted to do via the simular expression, was culculation YOY. Can I use set analysis to tackle the task?
- Mark as New
- Bookmark
- Subscribe
- Mute
- Subscribe to RSS Feed
- Permalink
- Report Inappropriate Content
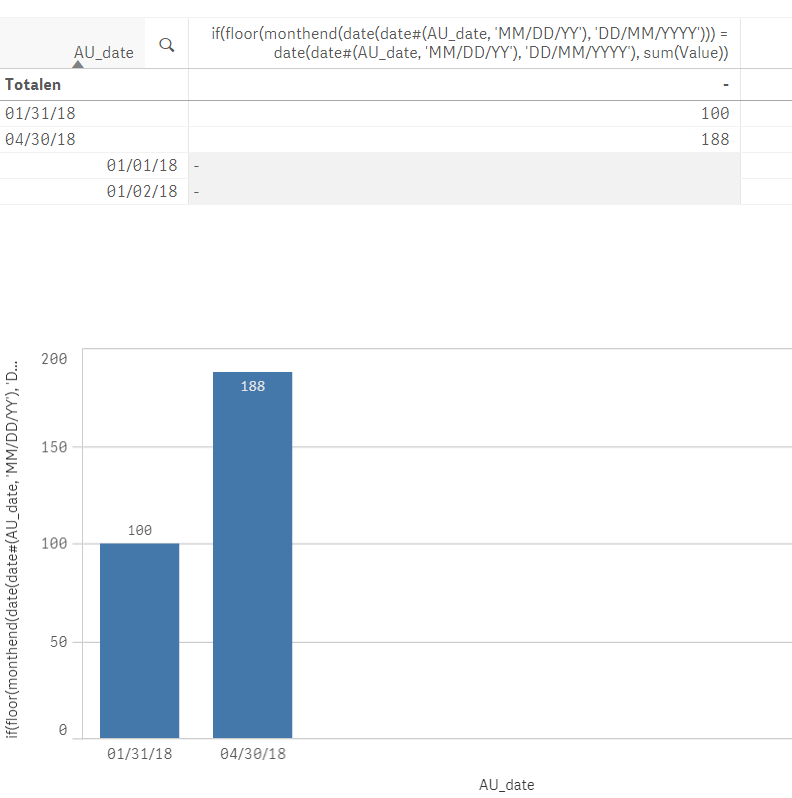
Not really as 'elegant' as set analysis... but maybe this helps:
if(floor(monthend(date(date#(AU_date, 'MM/DD/YY'), 'DD/MM/YYYY'))) = date(date#(AU_date, 'MM/DD/YY'), 'DD/MM/YYYY'), sum(Value))
This gives only the result of the value on the last day of the month ... I think that's what you mean.
(In data handling of the bar chart, you can choose to surpress the null values)
- Mark as New
- Bookmark
- Subscribe
- Mute
- Subscribe to RSS Feed
- Permalink
- Report Inappropriate Content
Should be ok.
Take a look at concept of as off tables too.
Thank You
Dilip Ranjith
Sent via mobile