Unlock a world of possibilities! Login now and discover the exclusive benefits awaiting you.
- Qlik Community
- :
- Forums
- :
- Analytics
- :
- New to Qlik Analytics
- :
- Get top sold product country wise in qlik sense
- Subscribe to RSS Feed
- Mark Topic as New
- Mark Topic as Read
- Float this Topic for Current User
- Bookmark
- Subscribe
- Mute
- Printer Friendly Page
- Mark as New
- Bookmark
- Subscribe
- Mute
- Subscribe to RSS Feed
- Permalink
- Report Inappropriate Content
Get top sold product country wise in qlik sense
Hi Friends
I want, top sold product country wise in table chart.
Something like this:
| Country Name | Product Name | Sales Amount |
|---|---|---|
| USA | P1 | 125148 |
| India | P6 | 362548 |
I have attached sample excel file and .qvf
Accepted Solutions
- Mark as New
- Bookmark
- Subscribe
- Mute
- Subscribe to RSS Feed
- Permalink
- Report Inappropriate Content
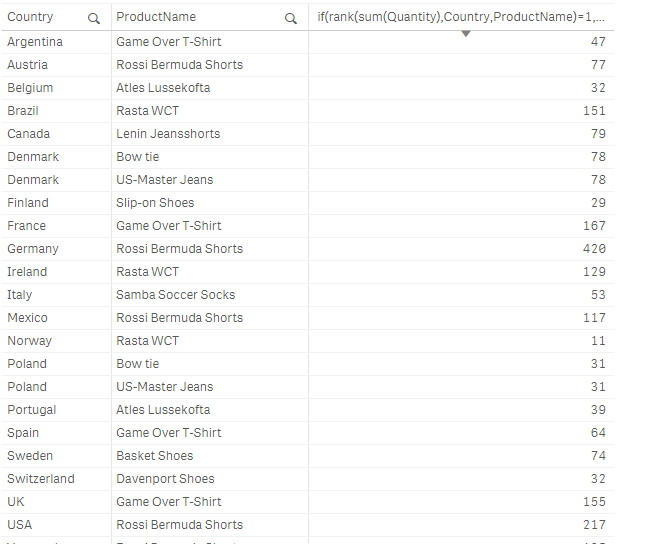
Do as follow:
create a simple table:
as dimensions:
dim 1 : Country
dim 2: ProductName
Measure : if(rank(sum(Quantity),Country,ProductName)=1,Sum(Quantity),0)
then, under adds on: uncheck show zero values
the result would be : (see the attached app)
- Mark as New
- Bookmark
- Subscribe
- Mute
- Subscribe to RSS Feed
- Permalink
- Report Inappropriate Content
Hi Omar
Thanks for your answer.
It is working perfectly fine, but sorting is not working on this column, I don't know why.
- Mark as New
- Bookmark
- Subscribe
- Mute
- Subscribe to RSS Feed
- Permalink
- Report Inappropriate Content
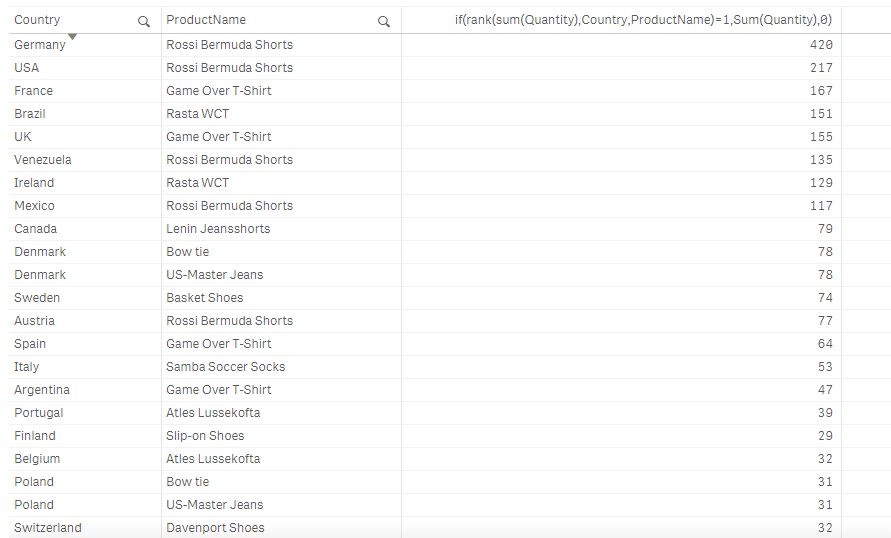
yes, since we're forcing things; sorting won't be possible directly when taping on the column title; u can sort by country: and put as an expression:
sum(Quantity)
:
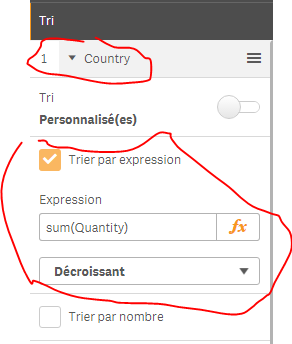
result:
Don't forget to close the thread by marking the correct answer as correct and the helpful ones as helpful 
- Mark as New
- Bookmark
- Subscribe
- Mute
- Subscribe to RSS Feed
- Permalink
- Report Inappropriate Content
Thanks Omar