Unlock a world of possibilities! Login now and discover the exclusive benefits awaiting you.
- Qlik Community
- :
- Forums
- :
- Analytics
- :
- New to Qlik Analytics
- :
- Getting Year and Quarter on the same axis in a lin...
- Subscribe to RSS Feed
- Mark Topic as New
- Mark Topic as Read
- Float this Topic for Current User
- Bookmark
- Subscribe
- Mute
- Printer Friendly Page
- Mark as New
- Bookmark
- Subscribe
- Mute
- Subscribe to RSS Feed
- Permalink
- Report Inappropriate Content
Getting Year and Quarter on the same axis in a line chart
Hi
Qlik Enthusiasts
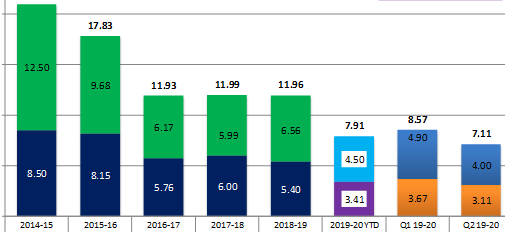
I have a requirement as shown in the attached image.
Can anyone help me with the solution or workaround?
Thanks and Regards
Manoj
- Mark as New
- Bookmark
- Subscribe
- Mute
- Subscribe to RSS Feed
- Permalink
- Report Inappropriate Content
How is your data constructed? I mean in the script?
This would only be possible if u do things in the script to create this new dimension:
I mean creating a new table like this :
NewTable:
load Year as NewDimension, sum(Measure) as YourMeasure resident table
where Year>=2019 group by Year ;
concatenate(NewTable)
load QuarterYear as NewDimension, sum(Measure) as YourMeasure resident table
where Year>=2019 group by QuarterYear ;
and use this NewDimension in the graph
dimension : NewDimension
Measure: sum(YourMeasure)
Et voilà !