Unlock a world of possibilities! Login now and discover the exclusive benefits awaiting you.
- Qlik Community
- :
- Forums
- :
- Analytics
- :
- New to Qlik Analytics
- :
- Re: Graph in line - cumulated cash flow
- Subscribe to RSS Feed
- Mark Topic as New
- Mark Topic as Read
- Float this Topic for Current User
- Bookmark
- Subscribe
- Mute
- Printer Friendly Page
- Mark as New
- Bookmark
- Subscribe
- Mute
- Subscribe to RSS Feed
- Permalink
- Report Inappropriate Content
Graph in line - cumulated cash flow
Hi,
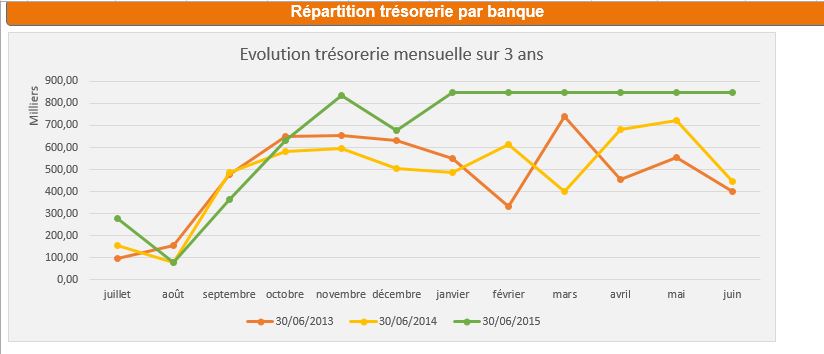
I would like to create a graph in line to analyse cumulated cashflow for a fiscal year with a comparison with precedent 2 years like this one.
I have tried to create a mesure "TRESORERIE CUMULEE" with the expression (found in a forum) :
rangesum( above( sum({$<FLAGTRESORERIE={1}>}SOLDE),0,rowno()))
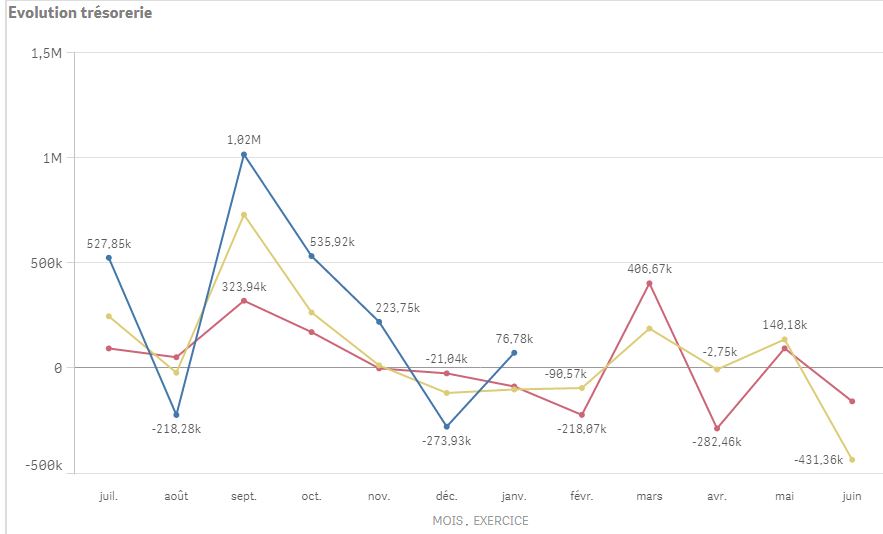
But it doesn't work...I get this graph..
My script :
SET DebutTreso1 = 50700000;
SET FinTreso1 = 50879999;
SET DebutTreso2 = 50900000;
SET FinTreso2 = 51779999;
SET DebutTreso3 = 51900000;
SET FinTreso3 = 51979999;
SET DebutTreso4 = 51990000;
SET FinTreso4 = 53999999;
...
[FEC RETRAITE]:
LOAD
JournalCode as [CODE JOURNAL],
JournalLib as [LIBELLE JOURNAL],
EcritureNum as [NUMERO ECRITURE],
CompteNum as [NUMERO COMPTE],
CompteLib as [LIBELLE COMPTE],
CompAuxNum as [NUMERO COMPTE AUXILIAIRE],
CompAuxLib as [LIBELLE COMPTE AUXILIAIRE],
PieceRef as [REFERENCE PIECE],
PieceDate as [DATE PIECE],
EcritureLib as [LIBELLE ECRITURE],
If (Sens='C',Montant * -1,Montant) AS SOLDE,
Date(Date#([EcritureDate],'YYYYMMDD'),'DD/MM/YYYY') as [DATE ECRITURE],
If(CompteNum >=$(DebutTreso1) and CompteNum <=$(FinTreso1) or CompteNum >=$(DebutTreso2) and CompteNum <=$(FinTreso2) or CompteNum >=$(DebutTreso3) and CompteNum <=$(FinTreso3) or CompteNum >=$(DebutTreso4) and CompteNum <=$(FinTreso4),1,0) as FLAGTRESORERIE
FROM [lib://TDB MSB/FEC ORIGINAL.qvd] (qvd);
CALENDRIER:
LOAD
*,
if(Num(MOIS)=7,1,
if(Num(MOIS)=8,2,
if(Num(MOIS)=9,3,
if(Num(MOIS)=10,4,
if(Num(MOIS)=11,5,
if(Num(MOIS)=12,6,
if(Num(MOIS)=1,7,
if(Num(MOIS)=2,8,
if(Num(MOIS)=3,9,
if(Num(MOIS)=4,10,
if(Num(MOIS)=5,11,
if(Num(MOIS)=6,12
)))))))))))) as FISCAL_MOIS_ID;
LOAD
Date(Date#([EcritureDate],'YYYYMMDD'),'DD/MM/YYYY') as [DATE ECRITURE],
Date(Date#([ValidDate],'YYYYMMDD'),'DD/MM/YYYY') as [EXERCICE],
Date(Date#([EcritureDate],'YYYYMMDD'),'MM/YYYY') as [MOIS ANNEE],
Month(Date#([EcritureDate],'YYYYMMDD')) as MOIS,
Year(Date#([EcritureDate],'YYYYMMDD')) as ANNEE
FROM [lib://TDB MSB/FEC ORIGINAL.qvd] (qvd);
Thank you for your help
Sincerely
- Mark as New
- Bookmark
- Subscribe
- Mute
- Subscribe to RSS Feed
- Permalink
- Report Inappropriate Content
Hi everybody,
I'm sorry but I would like to raise the question again of the discussion that I put in this forum two days ago.
I need to create this chart but I don't succeed in finding the answer in internet. I need your help
I managed to create cumulative sum with qlikview by using "full accumulation" in the chart properties but it's quite difficult in qlik sense.
According to my research in this forum, I need to use Rangesum fonction but I don't understand how this fonction works.
Could you explain to me how I have tu use this fonction ? With RecNow ?
You ll find attached a example in excel of what i would like to do.
Thank you very much
Sincerely