Unlock a world of possibilities! Login now and discover the exclusive benefits awaiting you.
- Qlik Community
- :
- Forums
- :
- Analytics
- :
- New to Qlik Analytics
- :
- Grouping current month and last month in a bar cha...
- Subscribe to RSS Feed
- Mark Topic as New
- Mark Topic as Read
- Float this Topic for Current User
- Bookmark
- Subscribe
- Mute
- Printer Friendly Page
- Mark as New
- Bookmark
- Subscribe
- Mute
- Subscribe to RSS Feed
- Permalink
- Report Inappropriate Content
Grouping current month and last month in a bar chart
I need to compare the current month against last month in a bar chart and I need it look like the 7-day rolling bar chart, but I need to retain the date value. When the bar chart is day of the week (instead of date), this week vs last week is grouped automatically. (NB: 30-day rolling comparison legend is incorrect and should say this month, last month) How do I make a side-by-side comparison for the second chart?
Thanks in advance
Ben
Accepted Solutions
- Mark as New
- Bookmark
- Subscribe
- Mute
- Subscribe to RSS Feed
- Permalink
- Report Inappropriate Content
Create a new field based on your Date field as below
either in load script while loading data
Day(Datefield) as DayNum
Then use DayNum as dimension in chart
Or in chart use below calculated dimension
Dimension
=Day(Datefield)
=Month
If a post helps to resolve your issue, please accept it as a Solution.
- Mark as New
- Bookmark
- Subscribe
- Mute
- Subscribe to RSS Feed
- Permalink
- Report Inappropriate Content
Create a Dual() value field as below
example
DummyData:
Load
Date
,Day(Date) as DayNum
,MonthName(Date) as Monthname
,Dual(Text(Date),Day(Date)) as DayText
,ceil(Rand()*100) as randomval
;
load date(today()-recno()) as Date
AutoGenerate(90);
Then in Chart use the Field DayText as dimension
example Measures:
CurrentMonth
sum({<Date={">=2022-10-01<=2022-10-30"}>}randomval)
PReviousMonth
sum({<Date={">=2022-09-01<=2022-09-31"}>}randomval)
If a post helps to resolve your issue, please accept it as a Solution.
- Mark as New
- Bookmark
- Subscribe
- Mute
- Subscribe to RSS Feed
- Permalink
- Report Inappropriate Content
Just use the Day dimension that has value 1,2,3,4,5,---30/31
you cannot have dates like 1-Jan-2022 Next to 1-Feb-2022
If a post helps to resolve your issue, please accept it as a Solution.
- Mark as New
- Bookmark
- Subscribe
- Mute
- Subscribe to RSS Feed
- Permalink
- Report Inappropriate Content
Thanks - but how do I replace the current dimension with your suggestion? When I add 'Day' into the Field section, I get the following:
Before:
After:
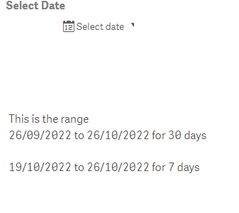
Definition of 'previous 30 days' measure for context:
- Mark as New
- Bookmark
- Subscribe
- Mute
- Subscribe to RSS Feed
- Permalink
- Report Inappropriate Content
Create a new field based on your Date field as below
either in load script while loading data
Day(Datefield) as DayNum
Then use DayNum as dimension in chart
Or in chart use below calculated dimension
Dimension
=Day(Datefield)
=Month
If a post helps to resolve your issue, please accept it as a Solution.
- Mark as New
- Bookmark
- Subscribe
- Mute
- Subscribe to RSS Feed
- Permalink
- Report Inappropriate Content
Got DayNum but can I overlay this with the actual dates for the first measure (i.e. current 30-days) on the bar chart
(In below example, 1 = 26/09/2022, 2 = 27/09/2022, etc...)
Thanks again
Ben
- Mark as New
- Bookmark
- Subscribe
- Mute
- Subscribe to RSS Feed
- Permalink
- Report Inappropriate Content
Create a Dual() value field as below
example
DummyData:
Load
Date
,Day(Date) as DayNum
,MonthName(Date) as Monthname
,Dual(Text(Date),Day(Date)) as DayText
,ceil(Rand()*100) as randomval
;
load date(today()-recno()) as Date
AutoGenerate(90);
Then in Chart use the Field DayText as dimension
example Measures:
CurrentMonth
sum({<Date={">=2022-10-01<=2022-10-30"}>}randomval)
PReviousMonth
sum({<Date={">=2022-09-01<=2022-09-31"}>}randomval)
If a post helps to resolve your issue, please accept it as a Solution.
- Mark as New
- Bookmark
- Subscribe
- Mute
- Subscribe to RSS Feed
- Permalink
- Report Inappropriate Content
Yeah, that solution does exactly what I needed it to. Thanks very much for your help!


