Unlock a world of possibilities! Login now and discover the exclusive benefits awaiting you.
- Qlik Community
- :
- Forums
- :
- Analytics
- :
- New to Qlik Analytics
- :
- Re: Grouping in Expression
- Subscribe to RSS Feed
- Mark Topic as New
- Mark Topic as Read
- Float this Topic for Current User
- Bookmark
- Subscribe
- Mute
- Printer Friendly Page
- Mark as New
- Bookmark
- Subscribe
- Mute
- Subscribe to RSS Feed
- Permalink
- Report Inappropriate Content
Grouping in Expression
Need help.
I am trying to generate a line chart in QlikSense Desktop to show counts by grouping a time stamp field with the help of expression.
The time stamp field used in the graph (END_TS_HR) is a computed field created using expression- Timestamp(END_TIME_STAMP,'YYYY-MM-DD hh:mm').
I am using below Aggr function to group STATISTIC_VALUE by END_TS_HR for the rows where STATISTIC_NAME = 'NumOrdersCreated'.
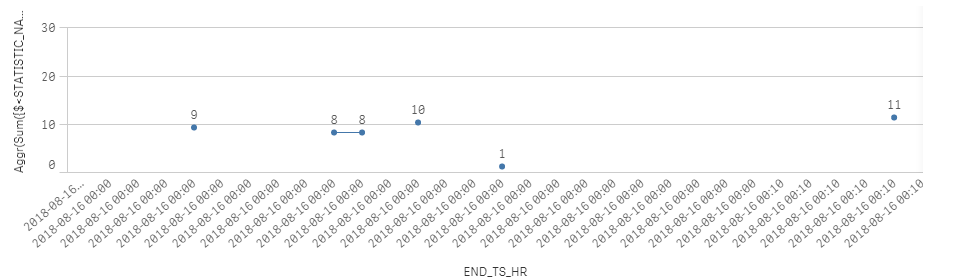
But the graph seems to shows END_TS_HR for all rows, irrespective of the value of STATISTIC_NAME.
Also the STATISTIC_VALUE is not getting grouped by END_TS_HR.
Dimension: END_TS_HR
Measure: Aggr(Sum({$<STATISTIC_NAME={'NumOrdersCreated'}>} STATISTIC_VALUE), END_TS_HR)
Expected result is -
END_TS_HR SUM
2018-08-16 00:00:00 36
2018-08-16 00:10:00 11
...
- Mark as New
- Bookmark
- Subscribe
- Mute
- Subscribe to RSS Feed
- Permalink
- Report Inappropriate Content
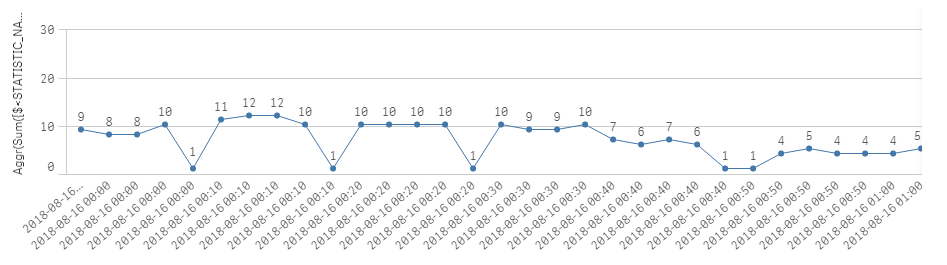
Update:
I was able to get rid of extra END_TS_HR that had no value, by un-checking Include Zero Values.
But I still have the challenge to group the STATISTIC_VALUE by END_TS_HR.
Dimensions and Measures are still same as before.
Here is current line chart.
- Mark as New
- Bookmark
- Subscribe
- Mute
- Subscribe to RSS Feed
- Permalink
- Report Inappropriate Content
Hi
Don't use aggr
Same with sum without aggr should work
So with aggr you will count also when stat_name is not what you want
If you have only sum your filter will be correct.
Regards
- Mark as New
- Bookmark
- Subscribe
- Mute
- Subscribe to RSS Feed
- Permalink
- Report Inappropriate Content
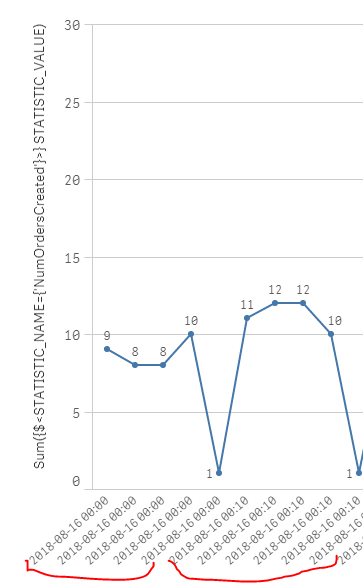
You are right Olivier, removing Aggr from measure expression also works-
Sum({$<STATISTIC_NAME={'NumOrdersCreated'}>} STATISTIC_VALUE).
However, it is still not grouping the STATISTIC_VALUE by END_TS_HR.
- Mark as New
- Bookmark
- Subscribe
- Mute
- Subscribe to RSS Feed
- Permalink
- Report Inappropriate Content
There is surely a problem with timestamp
You could try with date(date#(
It works better(look at posts with timestamp)
- Mark as New
- Bookmark
- Subscribe
- Mute
- Subscribe to RSS Feed
- Permalink
- Report Inappropriate Content
Date(Date#(END_TIME_STAMP,'YYYY-MM-DD hh:mm')) expression makes the computed field END_TS_HR blank.
Below expression for computing END_TS_HR works, but still do not see grouping of STATISTIC_VALUE by END_TS_HR. Above Graph stays same.
Date(END_TIME_STAMP,'YYYY-MM-DD hh:mm')
- Mark as New
- Bookmark
- Subscribe
- Mute
- Subscribe to RSS Feed
- Permalink
- Report Inappropriate Content
timestamp() is only formatting the timestamps, not grouping them per minute. I think what you need is to round the timestamps to the nearest ten minutes.
Change your calculated dimension to timestamp(round(END_TIME_STAMP,(10/(24*60))),'YYYY-MM-DD hh:mm')
If you want to specify if the function should round up or down change round() to either ceil() pr floor()