Unlock a world of possibilities! Login now and discover the exclusive benefits awaiting you.
- Qlik Community
- :
- Forums
- :
- Analytics
- :
- New to Qlik Analytics
- :
- Hello again! Help with Avgcounts, Min Max and Std ...
- Subscribe to RSS Feed
- Mark Topic as New
- Mark Topic as Read
- Float this Topic for Current User
- Bookmark
- Subscribe
- Mute
- Printer Friendly Page
- Mark as New
- Bookmark
- Subscribe
- Mute
- Subscribe to RSS Feed
- Permalink
- Report Inappropriate Content
Hello again! Help with Avgcounts, Min Max and Std Dev
Hi,
Can someone help me in deriving the desired output as in the attached document.
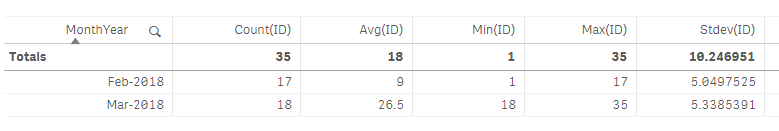
Brief Summary: I have transactions data for each day for the past 8 years (in fact it is at timestamp level). So i would like to create a summary dashboard that shows the Count of transactions, average transactions by Month, Min transactions max transactions that happened in that month and also Standard deviation.
Thank you!
- Mark as New
- Bookmark
- Subscribe
- Mute
- Subscribe to RSS Feed
- Permalink
- Report Inappropriate Content
Hi Sravan,
I have loaded your data with a simple script as follows:
Input:
LOAD TimeStamp,
Month(TimeStamp) as Month,
Year(TimeStamp) as Year,
Date(MonthStart(TimeStamp),'MMM-YYYY') as MonthYear,
ID
FROM [lib://Downloads/Sample Input and Output.xlsx]
(ooxml, embedded labels, header is 1 lines, table is Sheet1);
This gives you some Date dimensions to work with.
Then on the Sheets, create a straight table and add your measures..
- Mark as New
- Bookmark
- Subscribe
- Mute
- Subscribe to RSS Feed
- Permalink
- Report Inappropriate Content
Thank you Lisa. Can you please share with me the qvf file that you worked on? Thanks alot for your help!
- Mark as New
- Bookmark
- Subscribe
- Mute
- Subscribe to RSS Feed
- Permalink
- Report Inappropriate Content
QVF attached