Unlock a world of possibilities! Login now and discover the exclusive benefits awaiting you.
- Qlik Community
- :
- Forums
- :
- Analytics
- :
- New to Qlik Analytics
- :
- Re: Help displaying filtered dimensions in a chart
- Subscribe to RSS Feed
- Mark Topic as New
- Mark Topic as Read
- Float this Topic for Current User
- Bookmark
- Subscribe
- Mute
- Printer Friendly Page
- Mark as New
- Bookmark
- Subscribe
- Mute
- Subscribe to RSS Feed
- Permalink
- Report Inappropriate Content
Help displaying filtered dimensions in a chart
Hello
I want to display the following chart:
- reporting date (and some other dimension)
- some measure
the complication is that I want the measure to be calculated only for a subset of the reporting date - say for 2 reporting dates only, eg for September 2017 and August 2017
therefore in the measure I use a modifier for the reporting dates
the problem is that the chart still displays all reporting dates, even if for the dates other than Sep and Aug the value is 0.
of course this problem is solved if I make a manual selection using a filter, but I do not want to use the filter - I want the chart only to display the measure for these 2 dates only
the weirdness is that in the previous version of Qlik Sense the chart only displayed the dates for which the calculated measure was not zero and this remained like that until I modified the subtitle of this chart 
after modifying the subtitle, the chart started displaying all the dates
thank you for your help, I hope what I wrote is understandable
Accepted Solutions
- Mark as New
- Bookmark
- Subscribe
- Mute
- Subscribe to RSS Feed
- Permalink
- Report Inappropriate Content
- Mark as New
- Bookmark
- Subscribe
- Mute
- Subscribe to RSS Feed
- Permalink
- Report Inappropriate Content
Hi Liv,
With the sample code:
Date:
load * Inline
[
Mês,Compras Preço Custo,Compras Qtde,UF
01/01/2017,10,100,PB
02/01/2017,9,12,RN
03/01/2017,8,124,SP
04/01/2017,45,123,RJ
05/01/2017,11,123,ES
06/01/2017,98,73,RR
07/01/2017,823,66,SC
08/01/2017,123,123,MT
09/01/2017,123,665,PE
10/01/2017,1000,1000,SP
];
data:
Load
*,
Date(Mês,'MMM-YY') as [Month/Year]
Resident Date;
drop table Date;
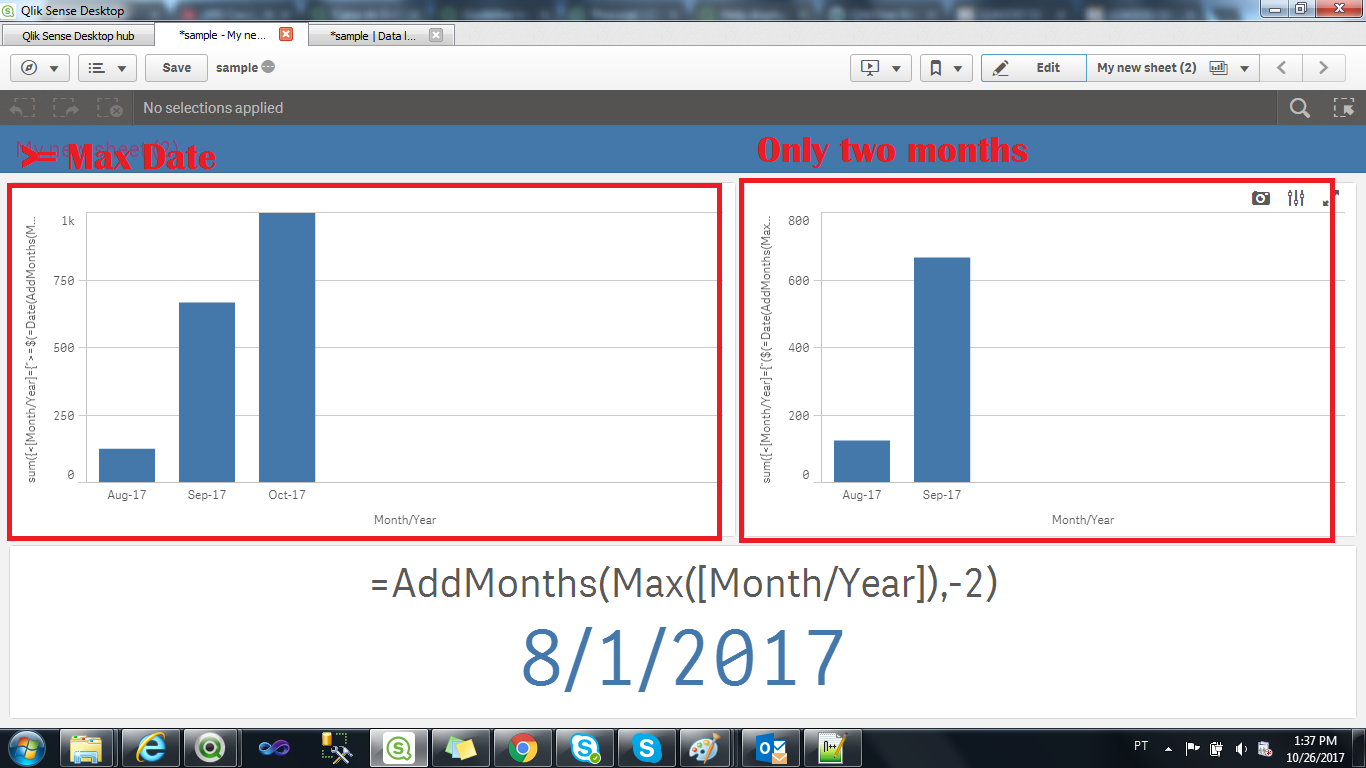
and expressions like:
// Gets the months that are gtreater than the max date of the dataset
sum({<[Month/Year]={">=$(=Date(AddMonths(Max([Month/Year]),-2),'MMM-YY'))"}>}[Compras Qtde])
// only gets two sample months
sum({<[Month/Year]={"($(=Date(AddMonths(Max([Month/Year]),-2),'MMM-YY'))|$(=Date(AddMonths(Max([Month/Year]),-1),'MMM-YY')))"}>}[Compras Qtde])
gets the following:
- Mark as New
- Bookmark
- Subscribe
- Mute
- Subscribe to RSS Feed
- Permalink
- Report Inappropriate Content
thank you
but look what happens if I add another dimension in the chart - UF in this case
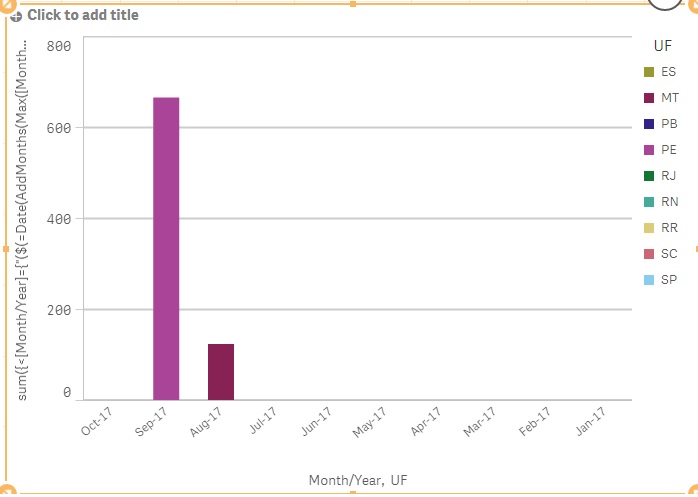
and this is exactly my original problem - I do not want to see the other reporting dates in this chart
thank you
LM
- Mark as New
- Bookmark
- Subscribe
- Mute
- Subscribe to RSS Feed
- Permalink
- Report Inappropriate Content
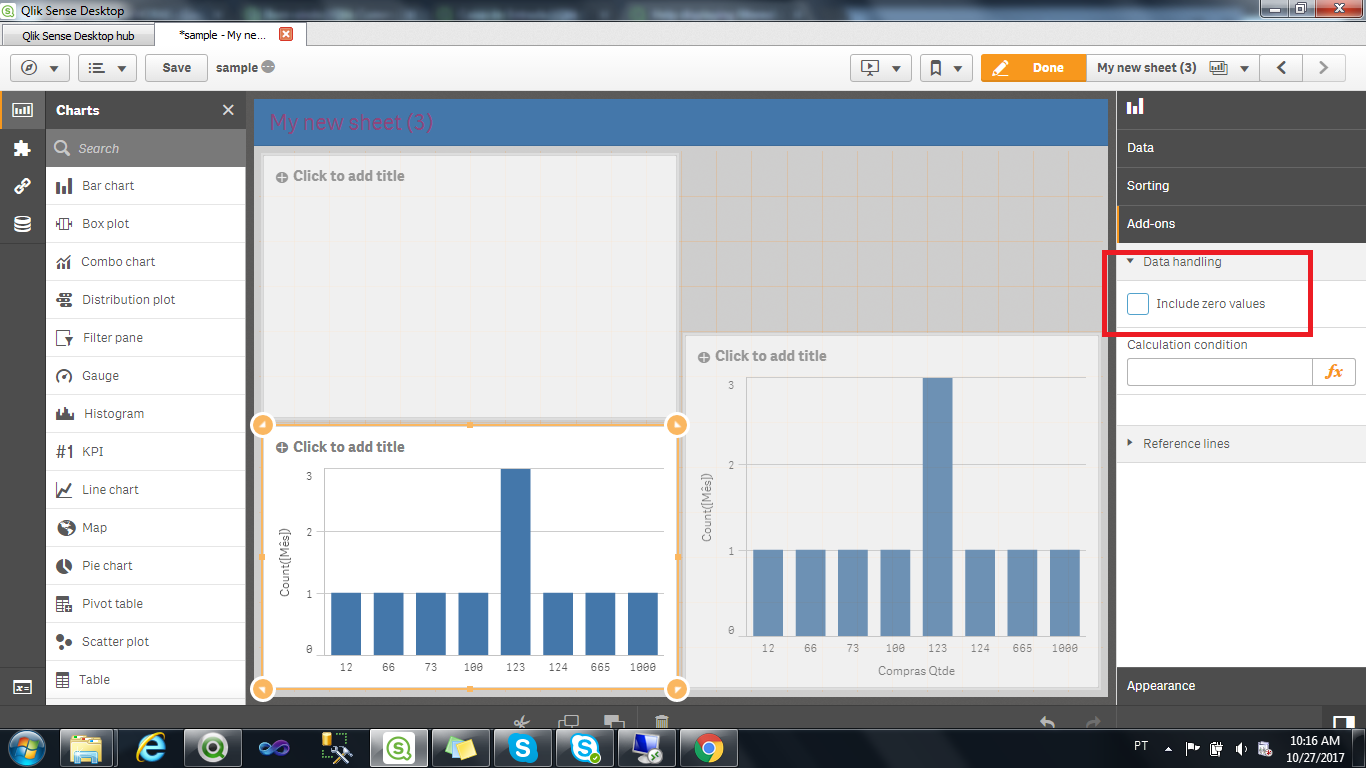
Did you uncheck this option?
- Mark as New
- Bookmark
- Subscribe
- Mute
- Subscribe to RSS Feed
- Permalink
- Report Inappropriate Content
no 
thank you very much for your time
LM
- Mark as New
- Bookmark
- Subscribe
- Mute
- Subscribe to RSS Feed
- Permalink
- Report Inappropriate Content
Glad it helped Liv .